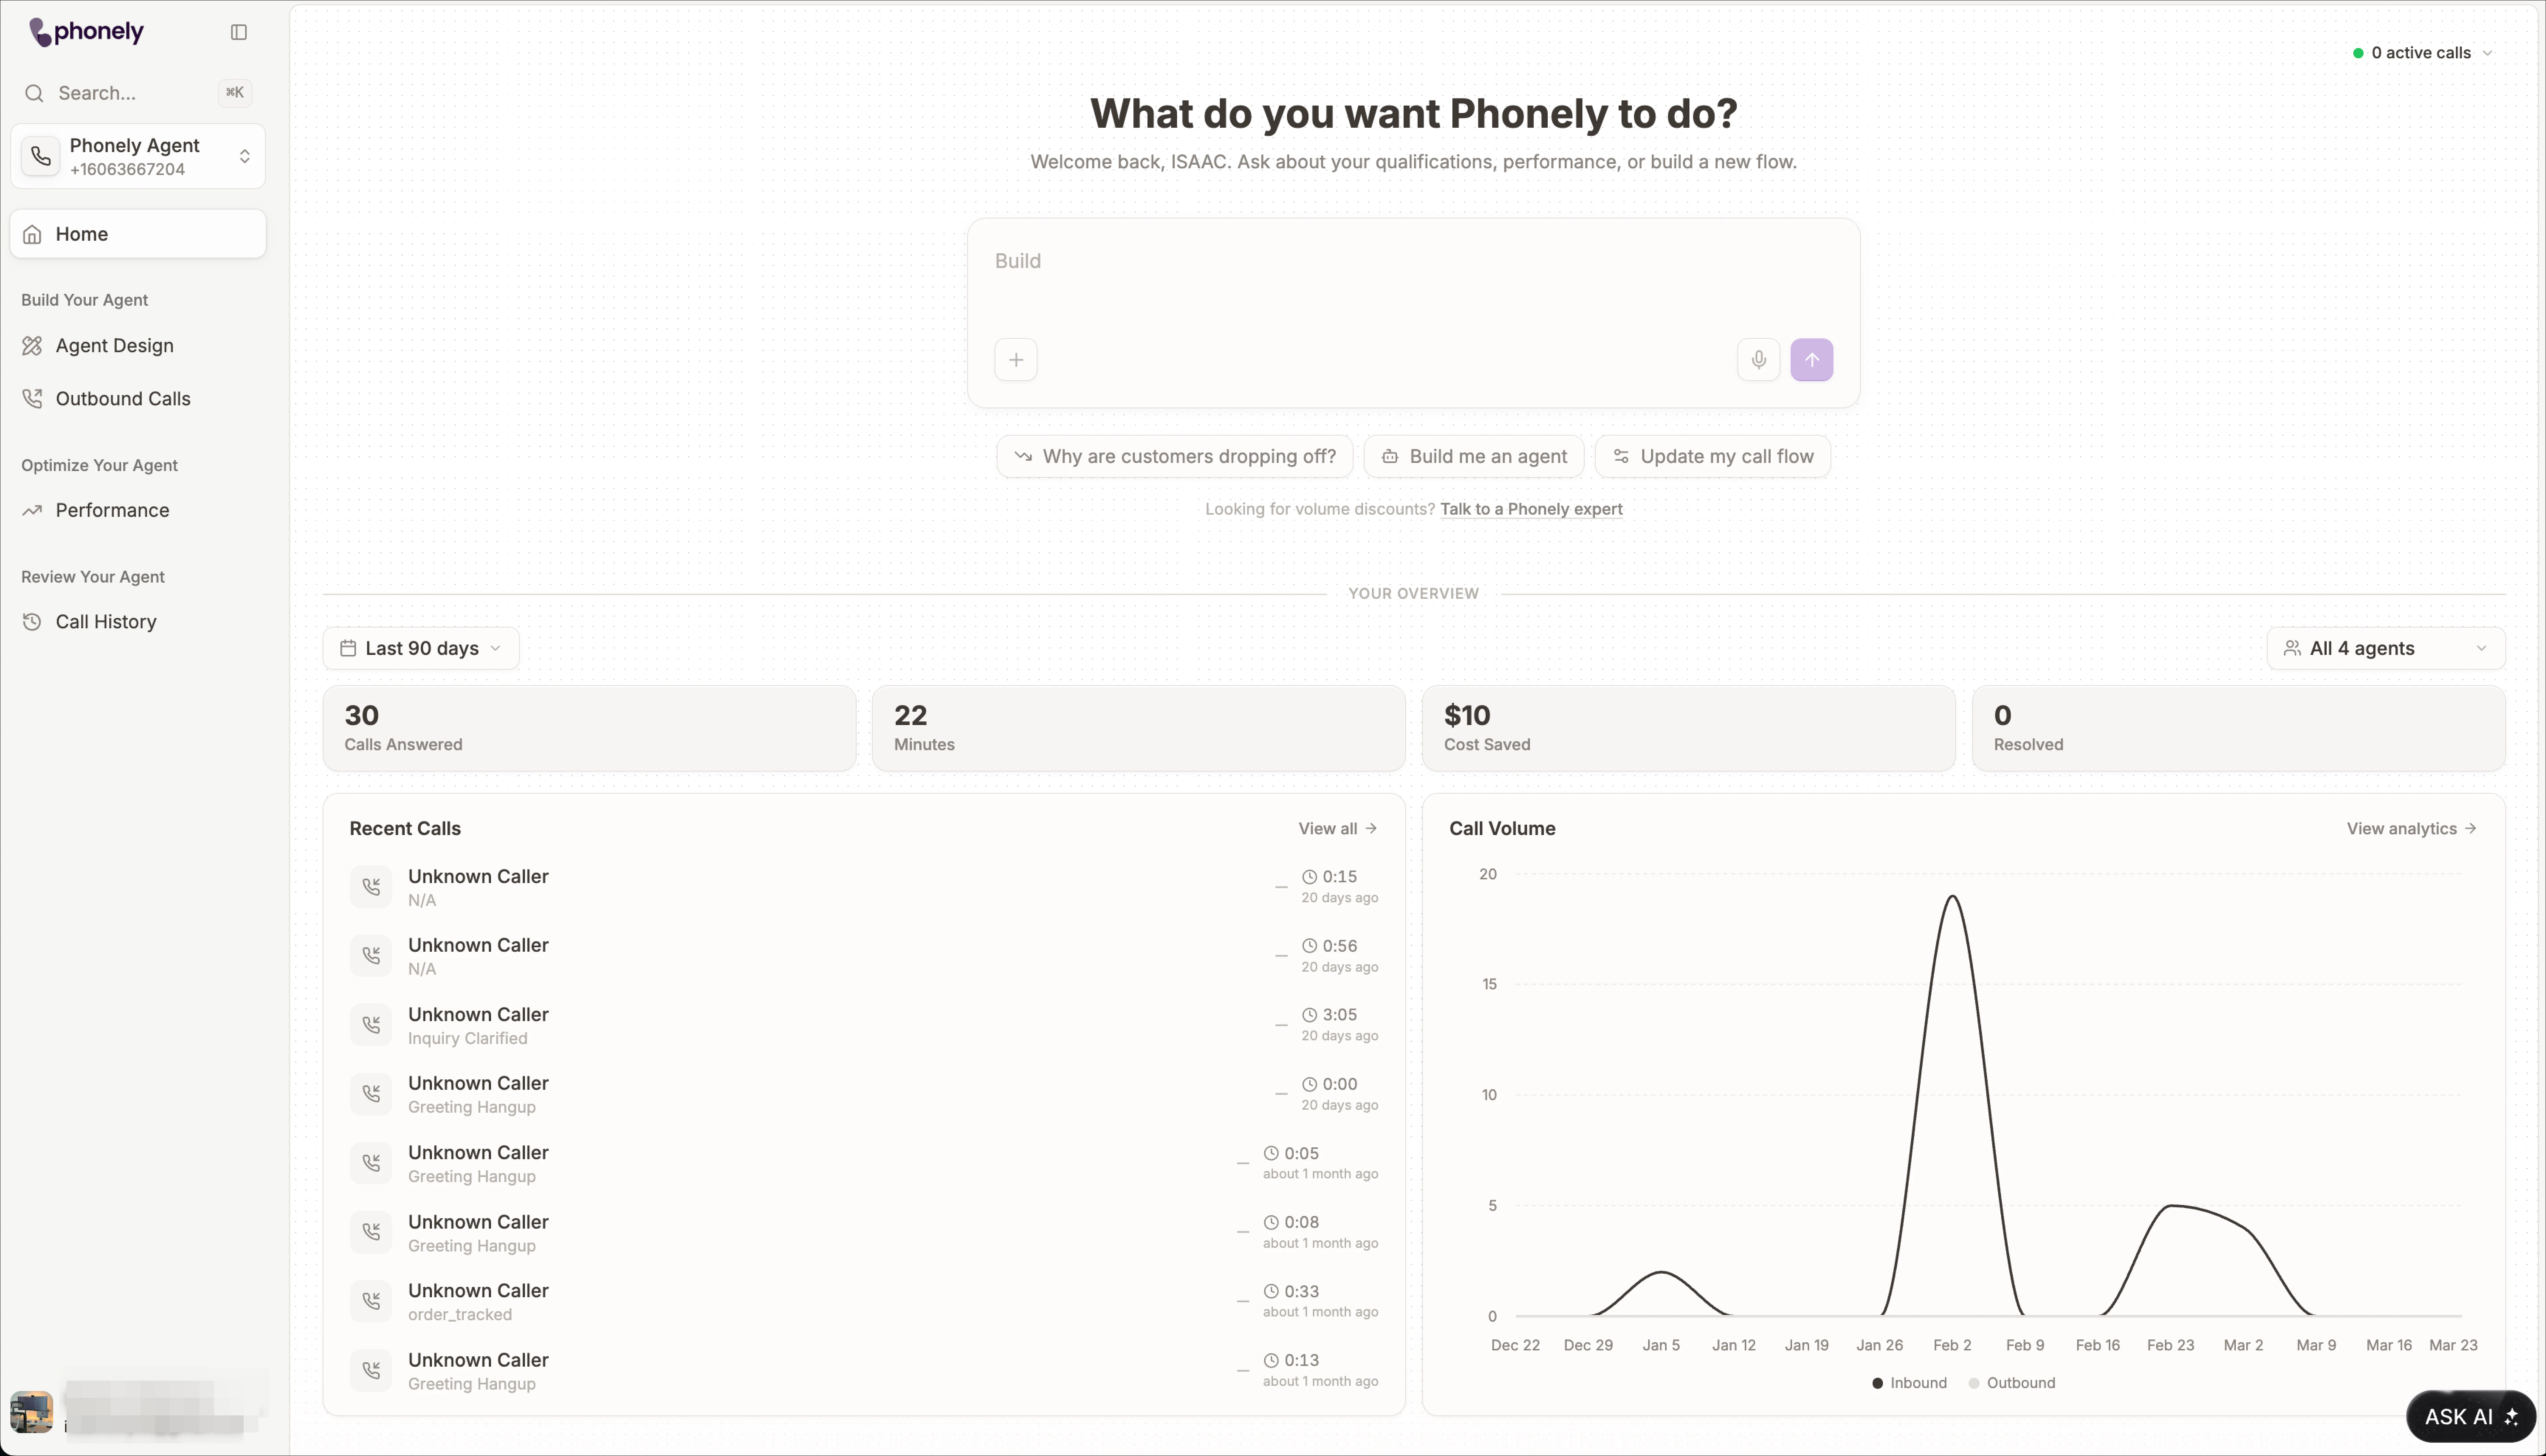
- How many calls have my agents handled recently?
- Are call volumes increasing or dropping?
- What kinds of call outcomes are showing up?
- Which agents should I review more closely?
- Do I need to open Call History, Analytics, or Billing next?
- Can Phonely help me investigate this without searching manually?
Choose your reporting scope
Before reviewing the numbers on this page, set the scope of the data you want to see. You can do this with:- The date range filter
- The agent filter
Select a date range
Use the date selector to choose the time period you want to review. The date picker includes preset ranges such as: Today, Last 7 days, Last 14 days, Last 30 days or Last 90 days These presets make it easy to switch quickly between common reporting windows. You can also choose a custom date range using the calendar panel. This is useful when you want to review a specific time period that does not match one of the preset options. Choose a shorter range when you want to inspect recent behavior more closely. Choose a longer range when you want a broader overview of trends.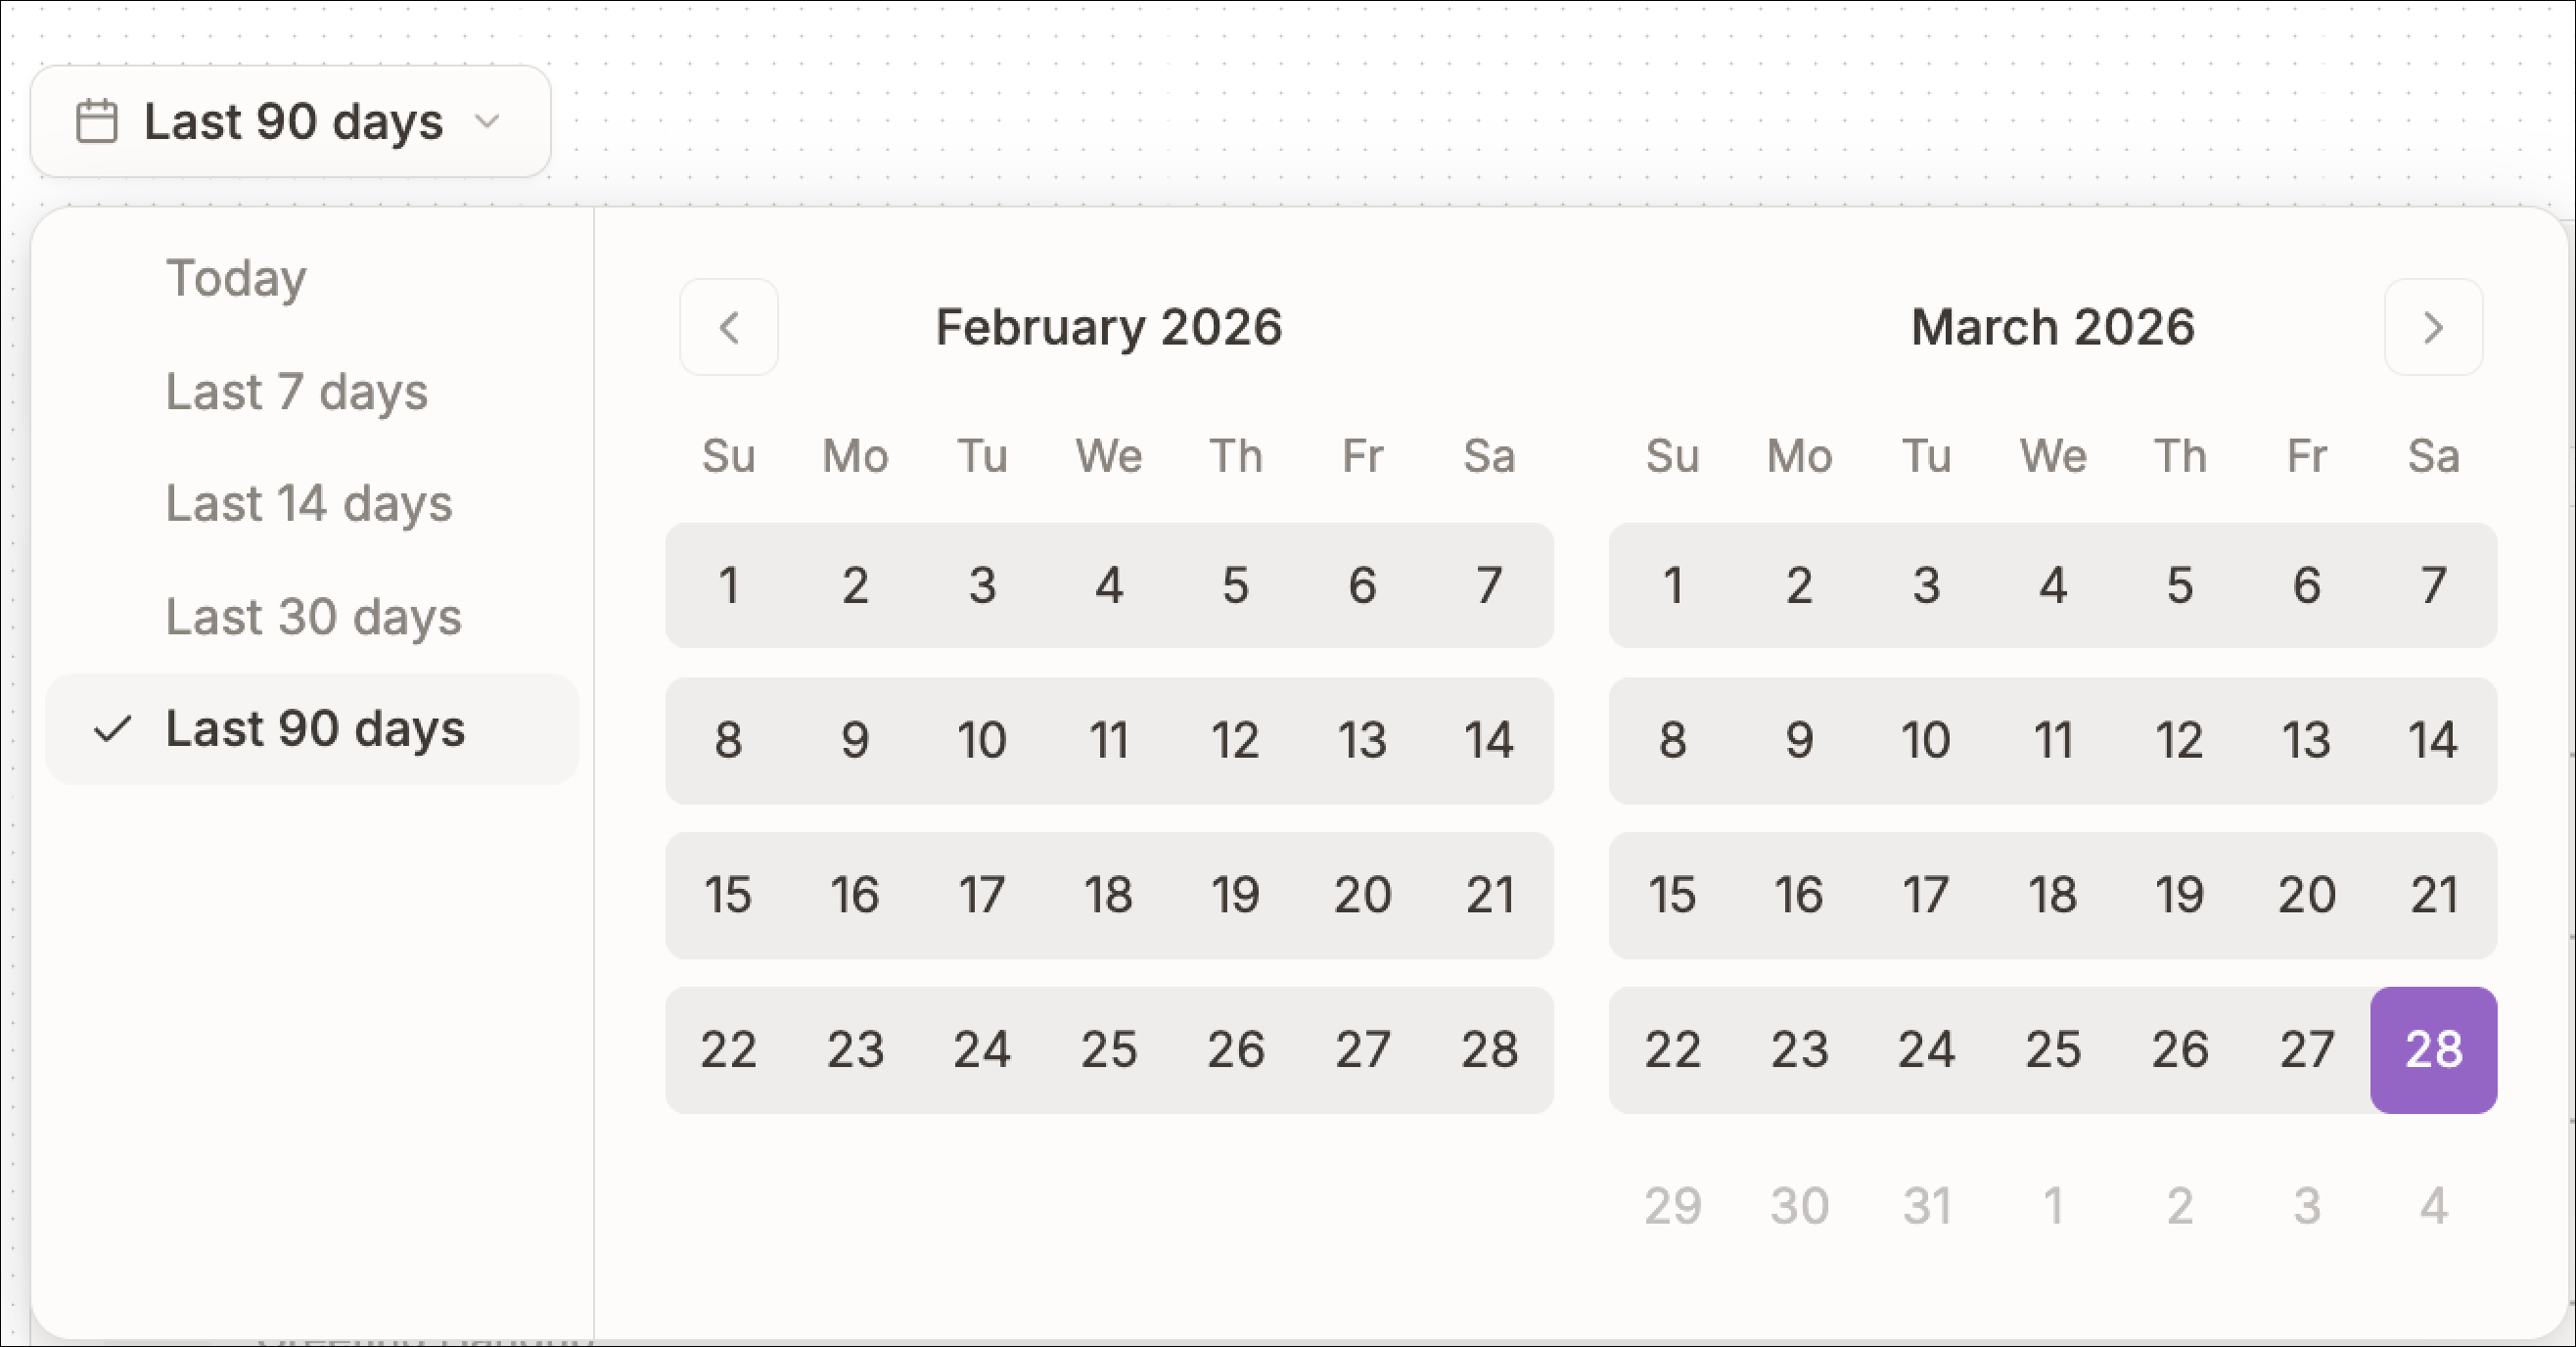
Filter by agent
Use the agent filter to choose which agent’s metrics you want to view on the Home page. By default, the page can show data for all agents, but you can narrow the view to one or more selected agents. Once selected, the overview cards, recent calls, and call volume chart update to reflect only those agents. This is useful when you want to focus on a specific agent instead of reviewing workspace-wide activity.Monitor active calls
In the top-right corner of the Home page, Phonely shows an active calls indicator. This lets you quickly see how many calls are currently in progress across your workspace. A green status dot appears next to the count to show that live monitoring is active. Click the active calls indicator to open the live calls panel. This panel shows the calls that are currently in progress, including the agent handling the call, the caller or phone number, the current status such as In Conversation, and the elapsed call time.
Overview cards for a quick health check
Once your filters are set, the metric cards give you a fast summary of what has happened during that period. These cards help you answer:- How many calls were answered
- How much total call time was handled
- How much value or cost savings were generated
- How many calls were resolved
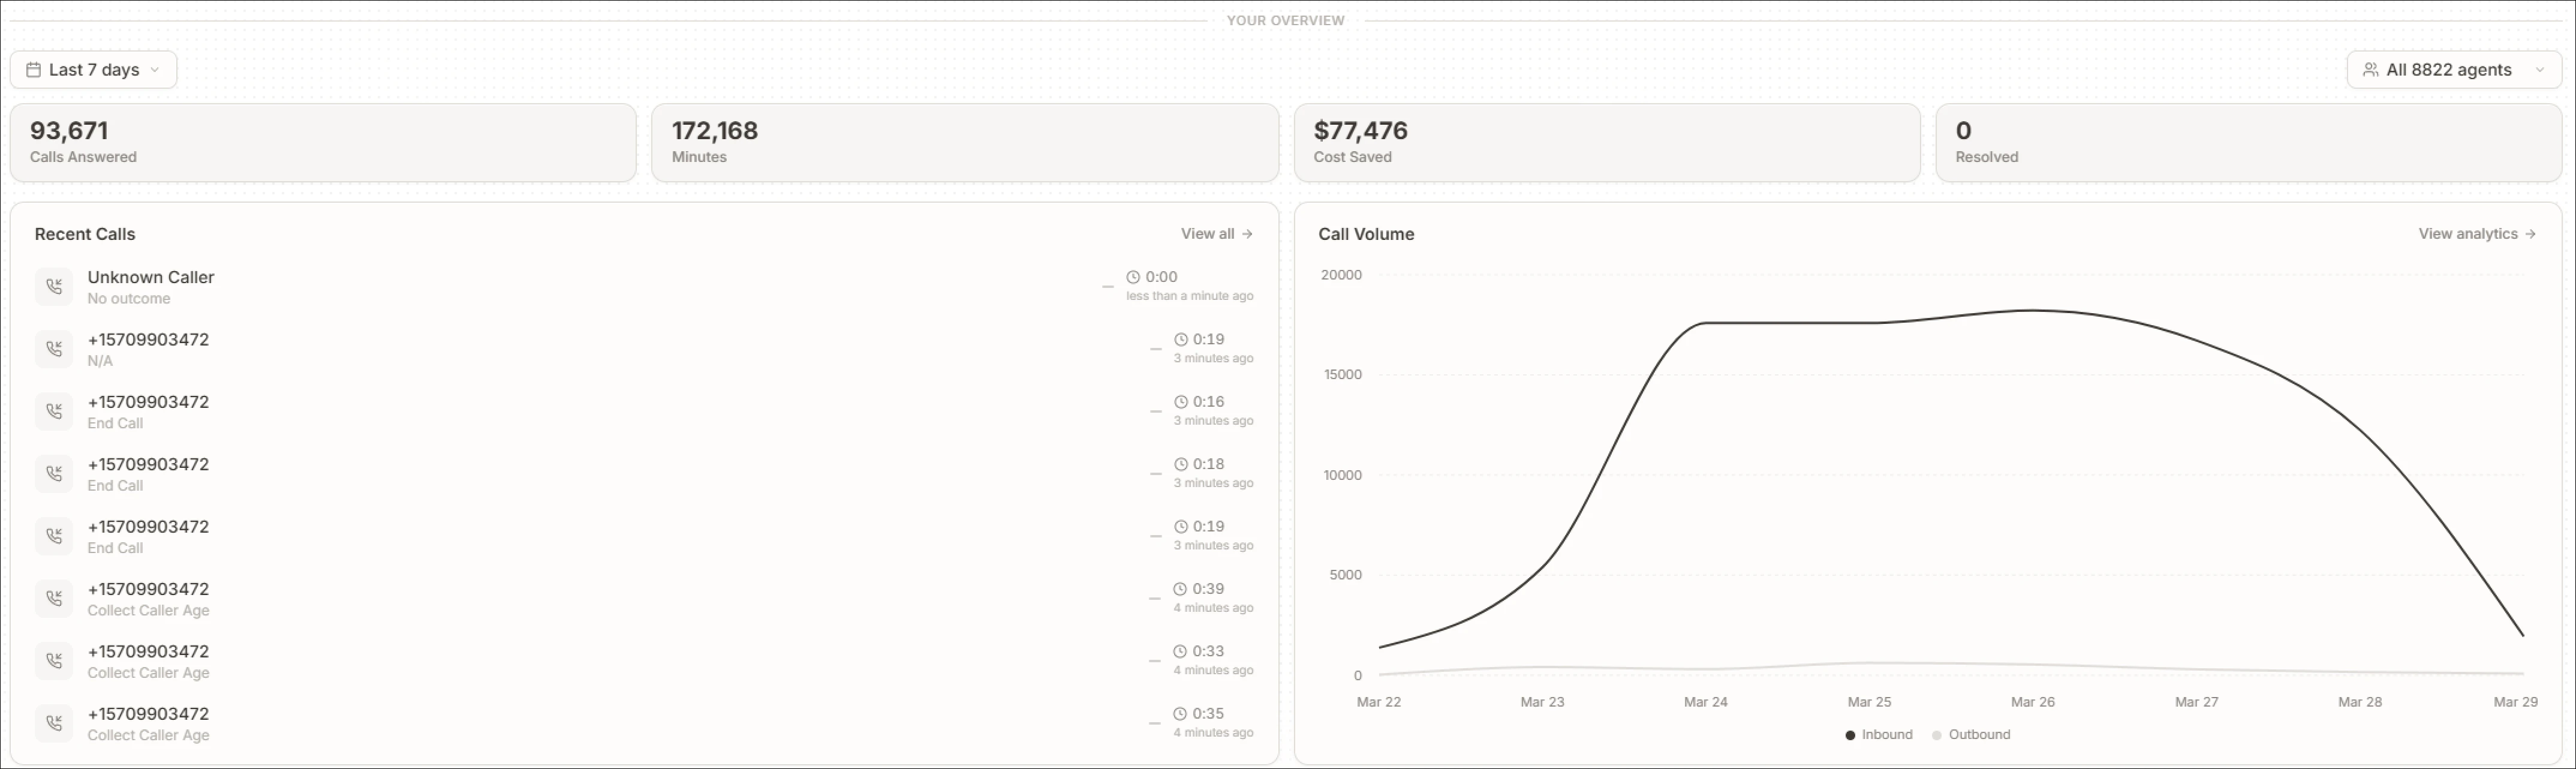
Calls Answered
Use this card to quickly understand handled call volume. This is usually the first number to check when asking:- Are my agents being used?
- Was activity higher or lower than expected?
Minutes
Use this card when you want to understand total call time, not just count. If you want deeper performance analysis, open performance analytics.Cost Saved
Use this card to understand the value generated by your agents during the selected period. This is helpful for:- Internal reporting
- Operational impact checks
- Comparing value over time
Resolved
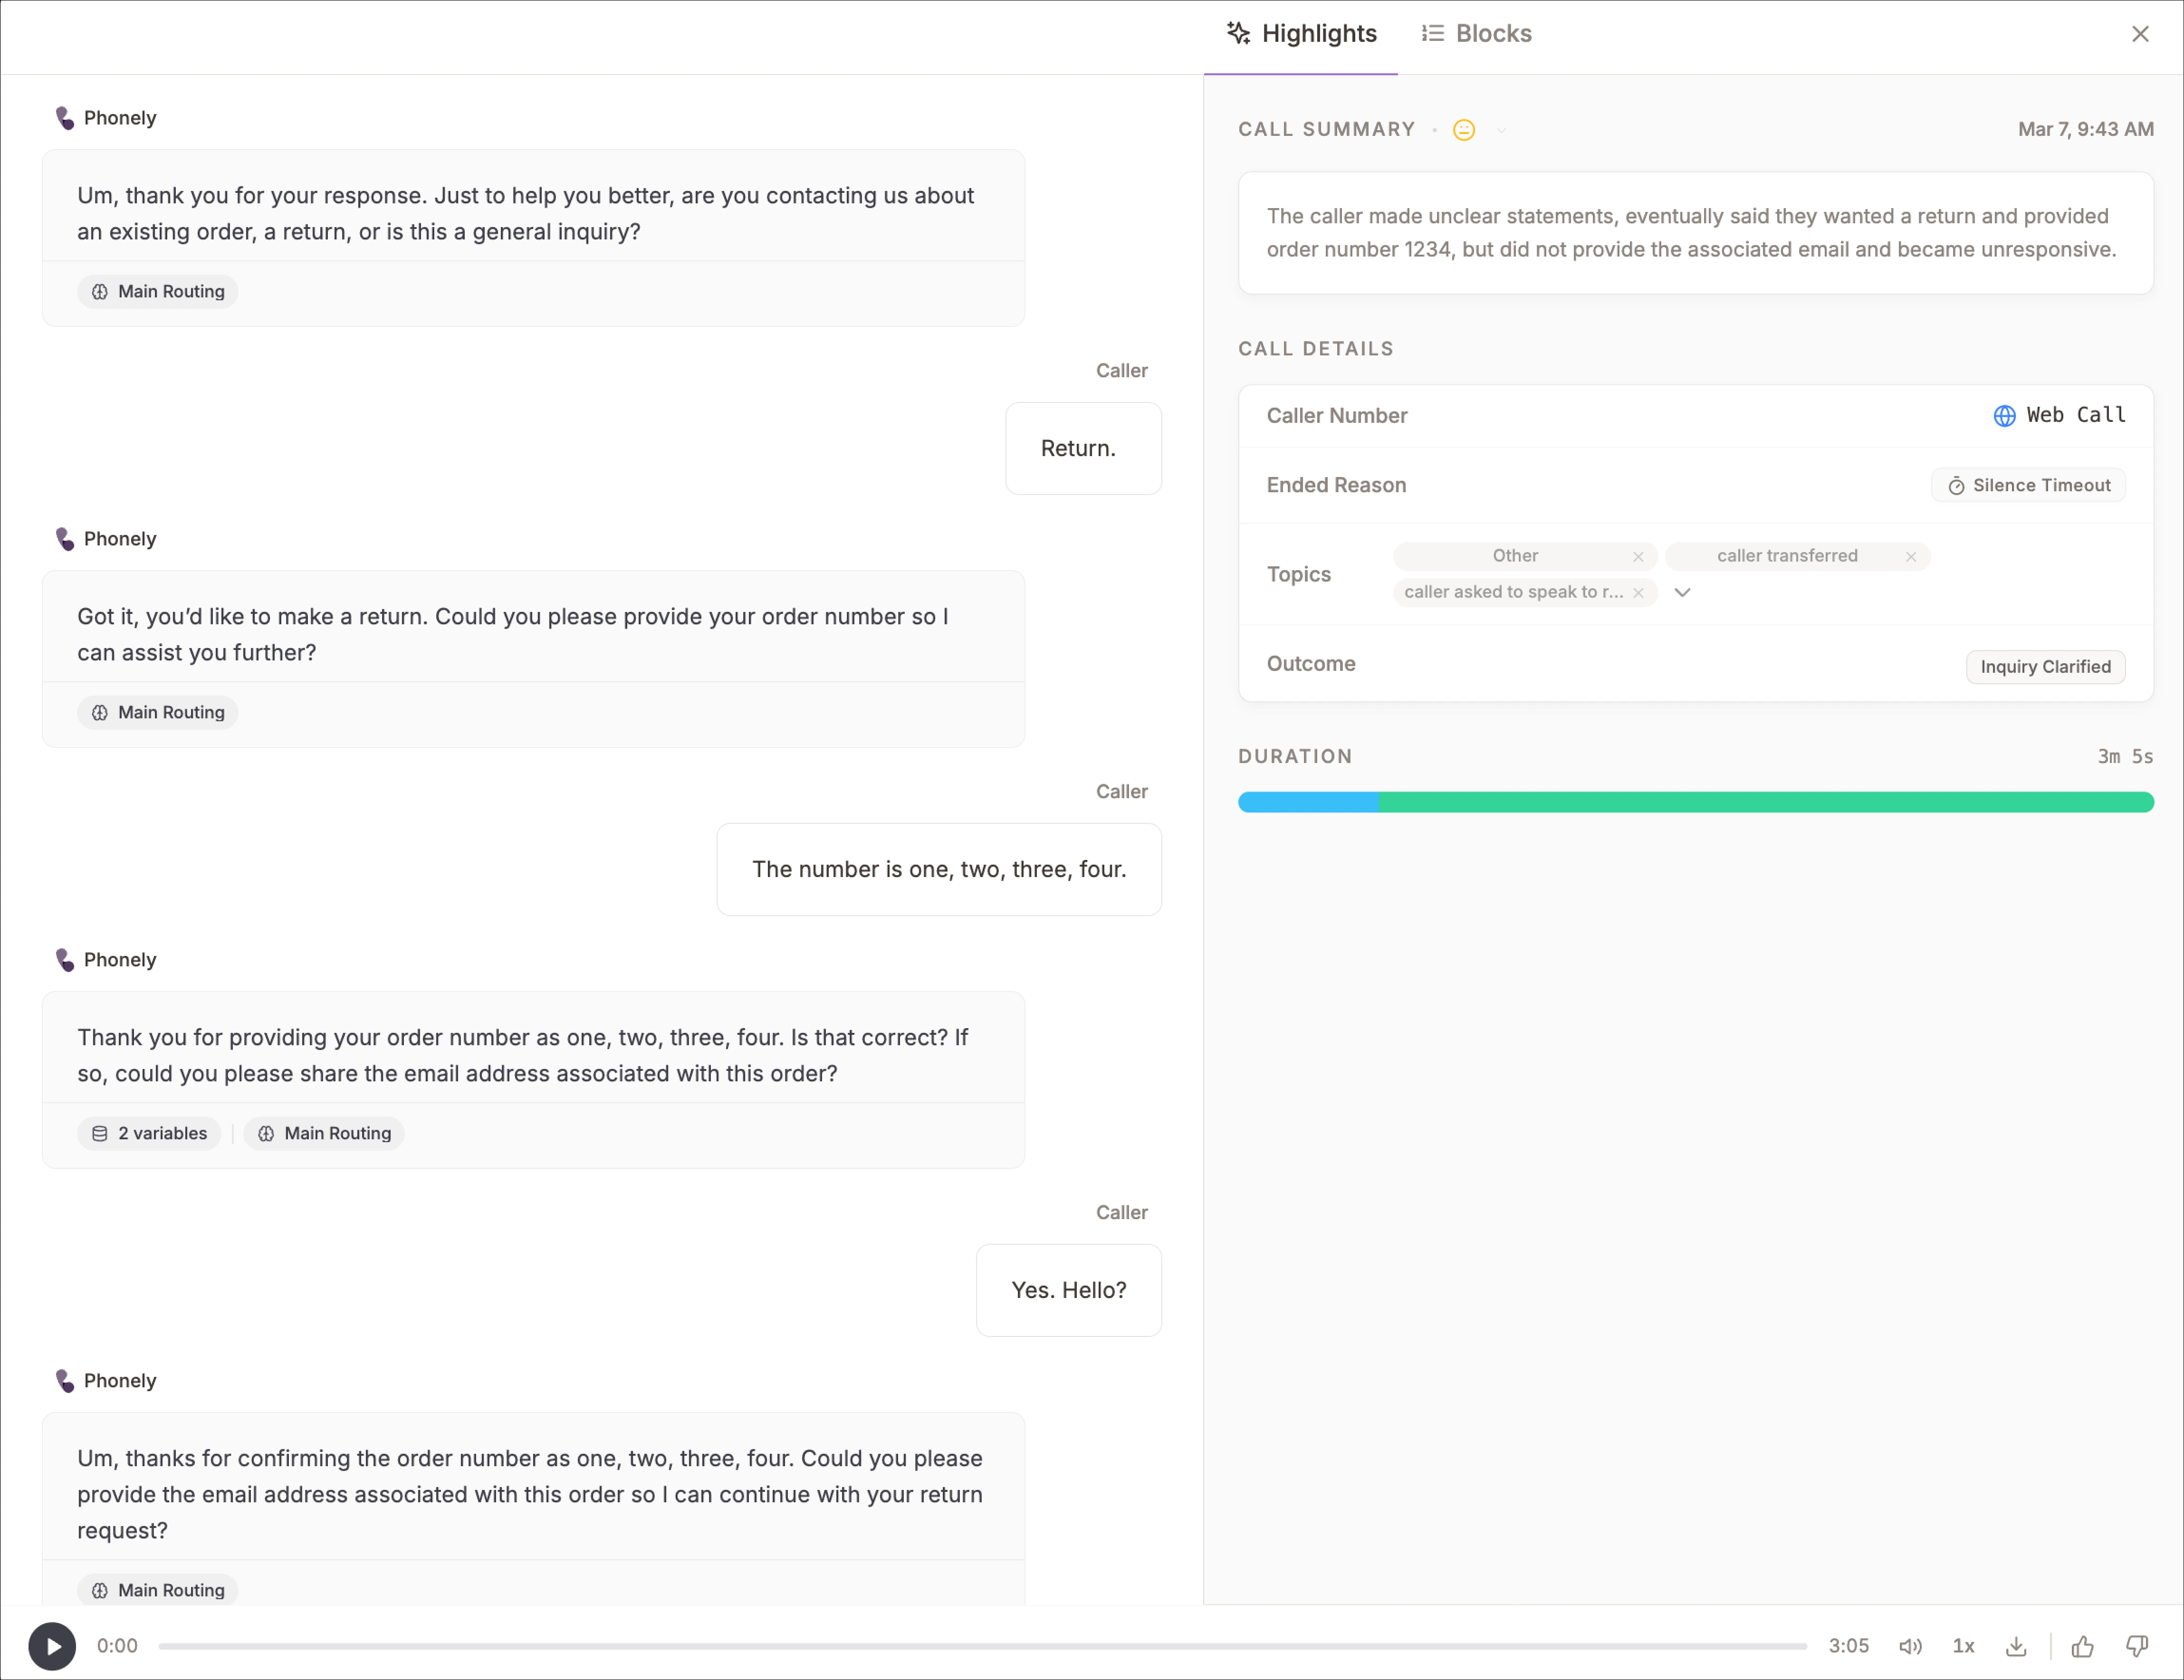
Use this card to see how many calls were marked as resolved. This is useful when you want to know whether calls are ending successfully, not just being answered. If this number seems low or inaccurate, review your outcomes and classifications.Recent Calls
The recent calls section helps you move from summary metrics to real examples. Use it when you want to quickly check:- What callers are experiencing
- Which outcomes are appearing most often
- Whether hangups are happening frequently
- Whether recent calls look normal
- Many calls ending in Greeting Hangup
- Repeated Unknown Caller entries
- Recurring outcomes like Inquiry Clarified
- Very short calls that may signal drop-offs
- Specific call types you may want to inspect in detail
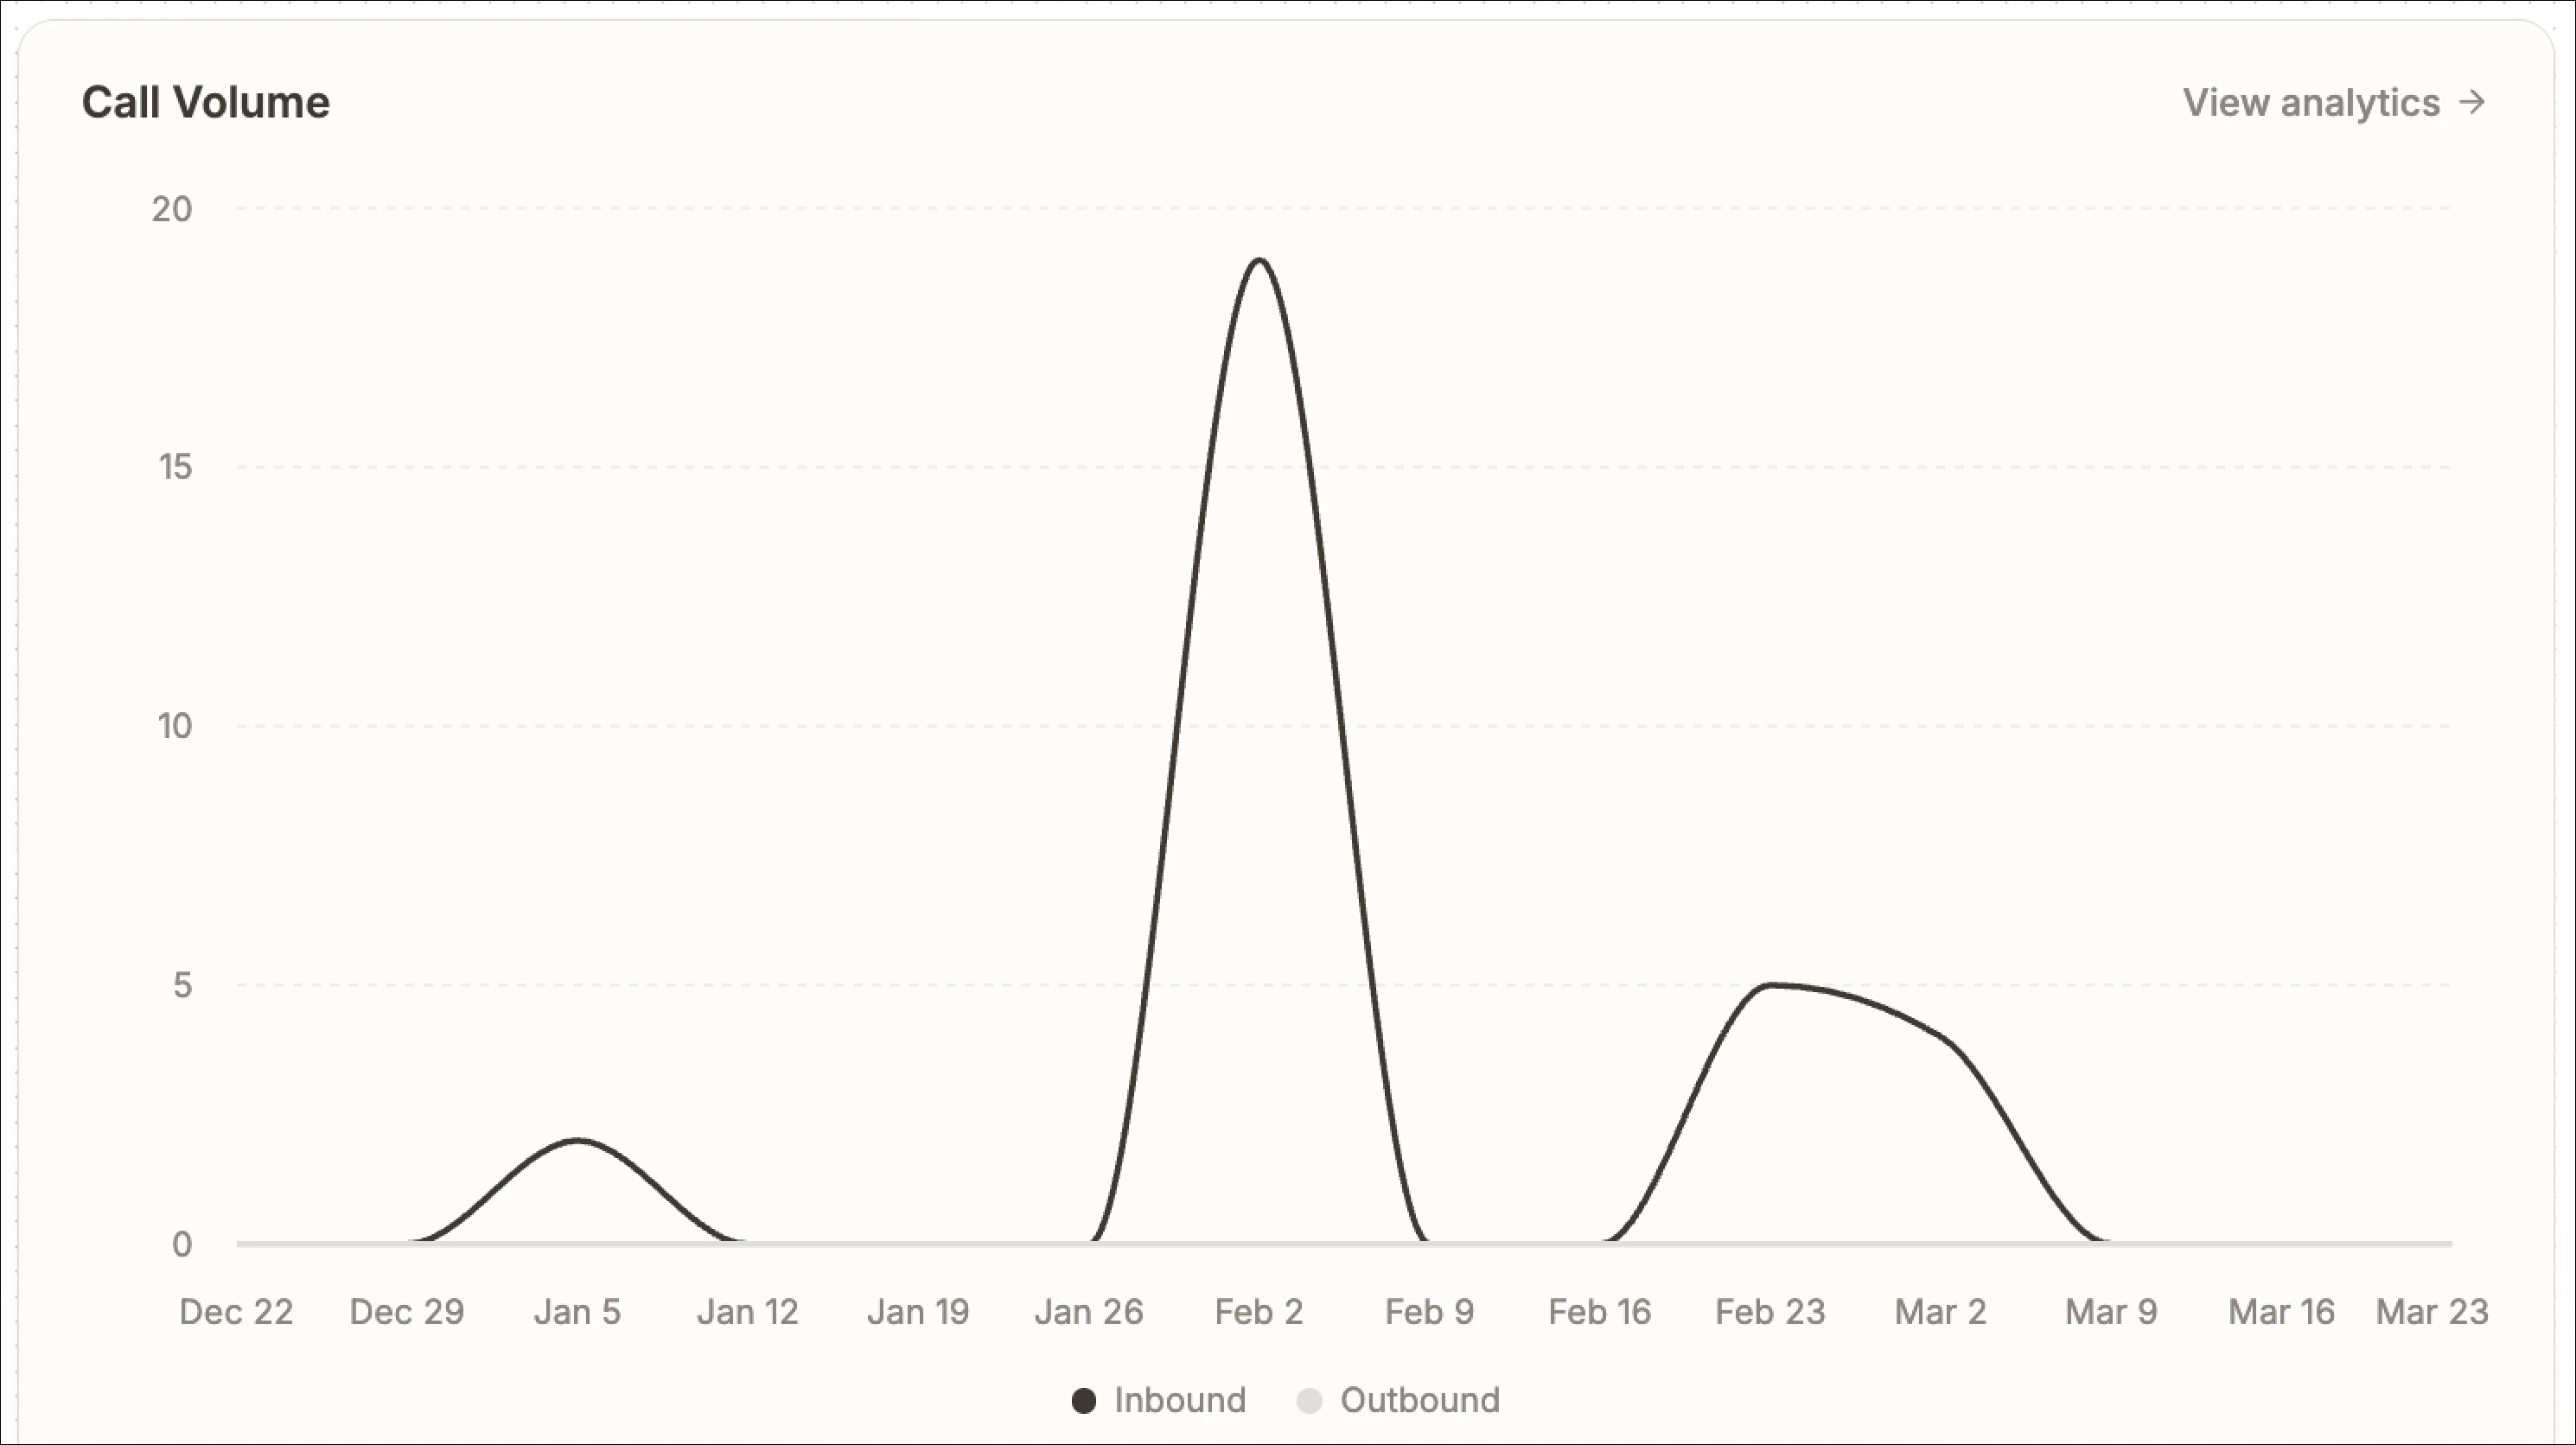
Call Volume
The call volume chart helps you understand how activity changes over time. Use it when you want to answer questions such as:- Are calls increasing or dropping?
- Was there a spike in call traffic?
- Has activity changed recently?
- Do inbound and outbound patterns look normal?
- Increased customer demand
- A campaign drove more calls
- An issue caused more support traffic
Keyboard Shortcuts
At the bottom of the page you’ll find quick-reference shortcuts:| Shortcut | Action |
|---|---|
Cmd K | Search |
Cmd J | AI chat |
Cmd S | Settings |
? | All shortcuts |