- Where do callers most commonly exit?
- Which block causes people to hang up?
- Did my latest workflow change improve the route people take?
- How does behavior differ between workflow versions?
1
From the left sidebar, go to the Analytics section.
2
Click Call Path.
3
The canvas loads with your workflow diagram and call-volume overlays. The call path page has four main areas:
- Top controls (date range, flow version filter, and call filters)
- The flow canvas (the visual path calls took)
- A flow selector along the bottom (switch between workflows)
- A details panel that opens when you click nodes (with Details and Metrics tabs)

Top controls
Date range
Use the date range dropdown to choose the window used to calculate volumes and percentages in the diagram. Common presets include last 24 hours, last 7 days, last 30 days, and last 90 days.
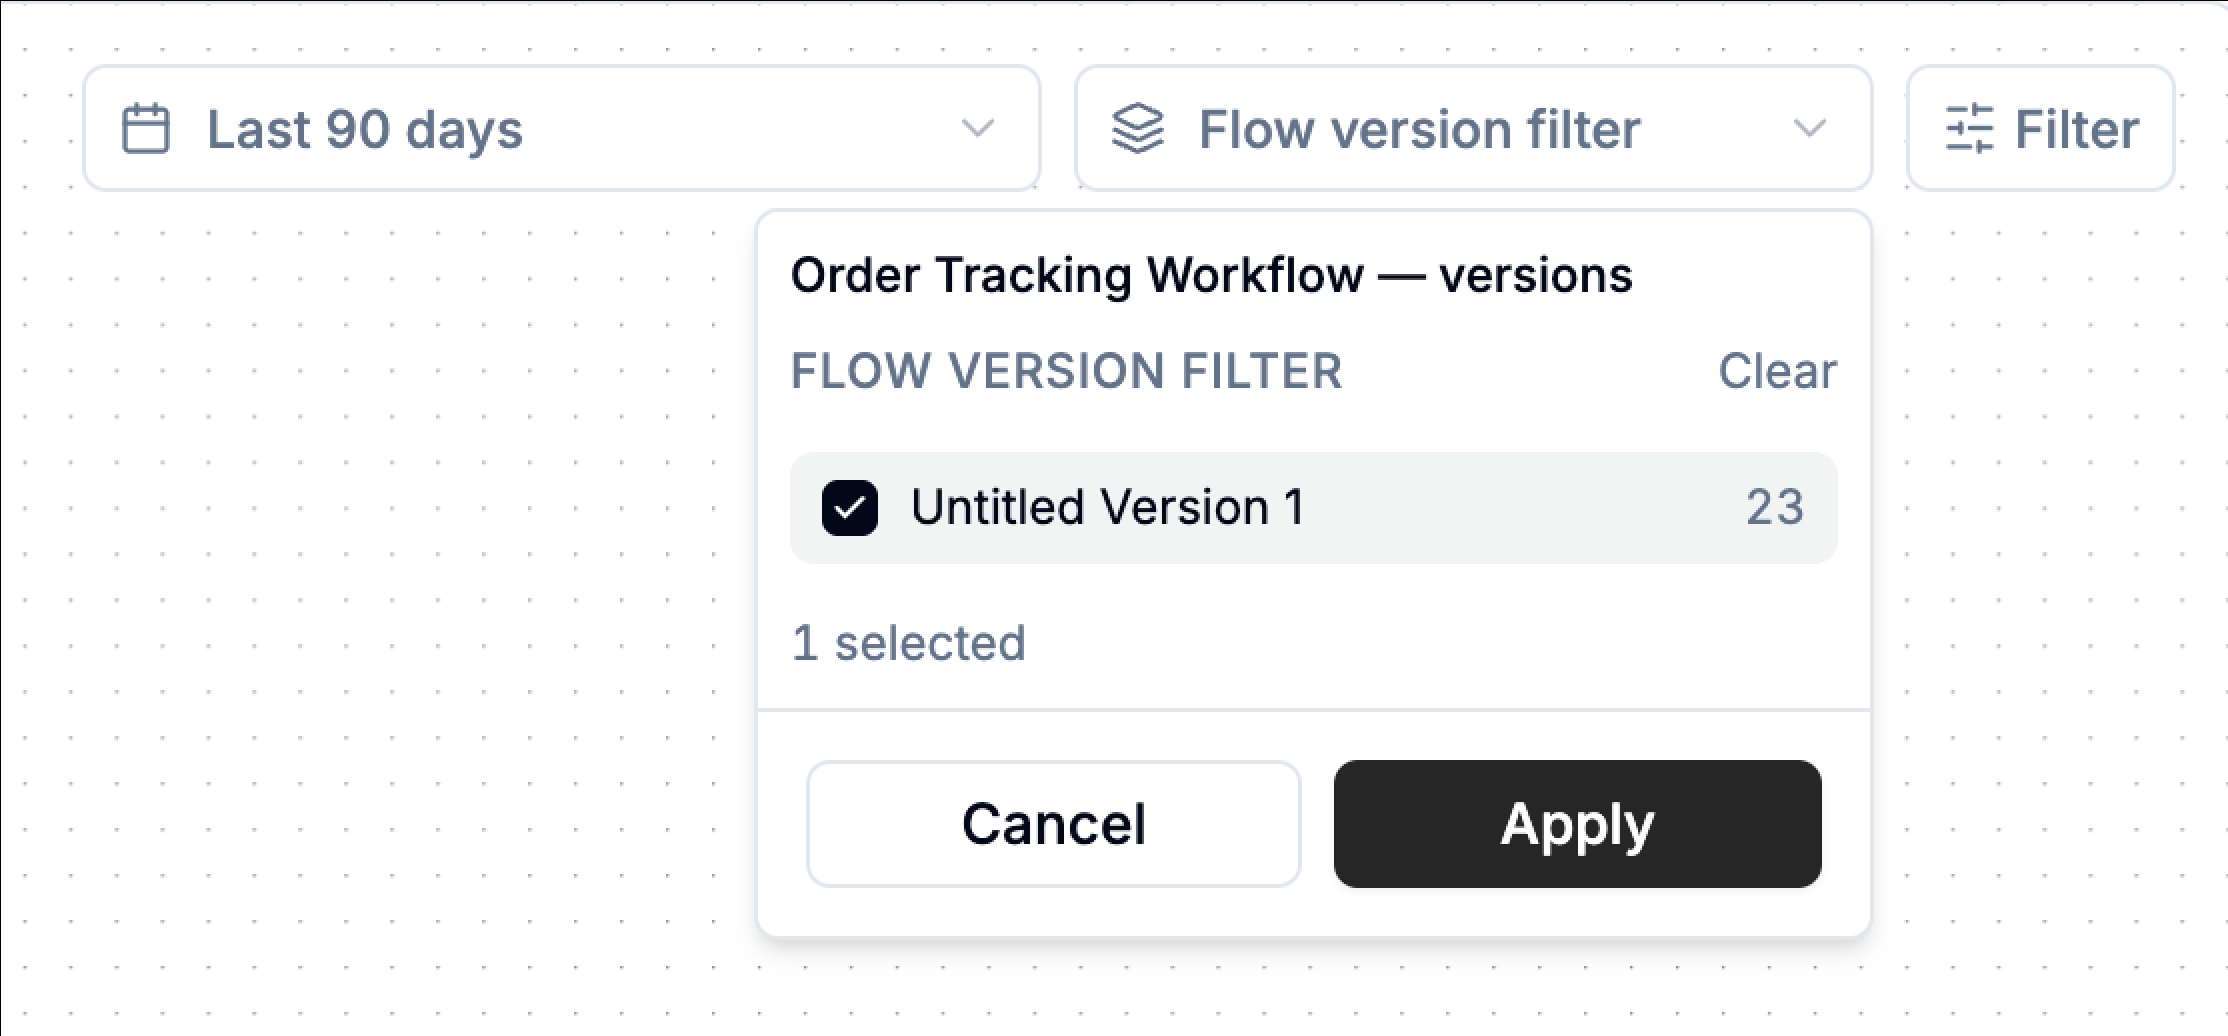
Flow version filter
The flow version filter lets you isolate calls that ran on specific versions of a workflow. How it works:1
Click Flow version filter (top-right).
2
Select one or more versions (you’ll see a count beside each version).
3
Click Apply to filter the diagram to calls that used those versions.
4
Use Clear to remove the version filter and return to “all versions.”
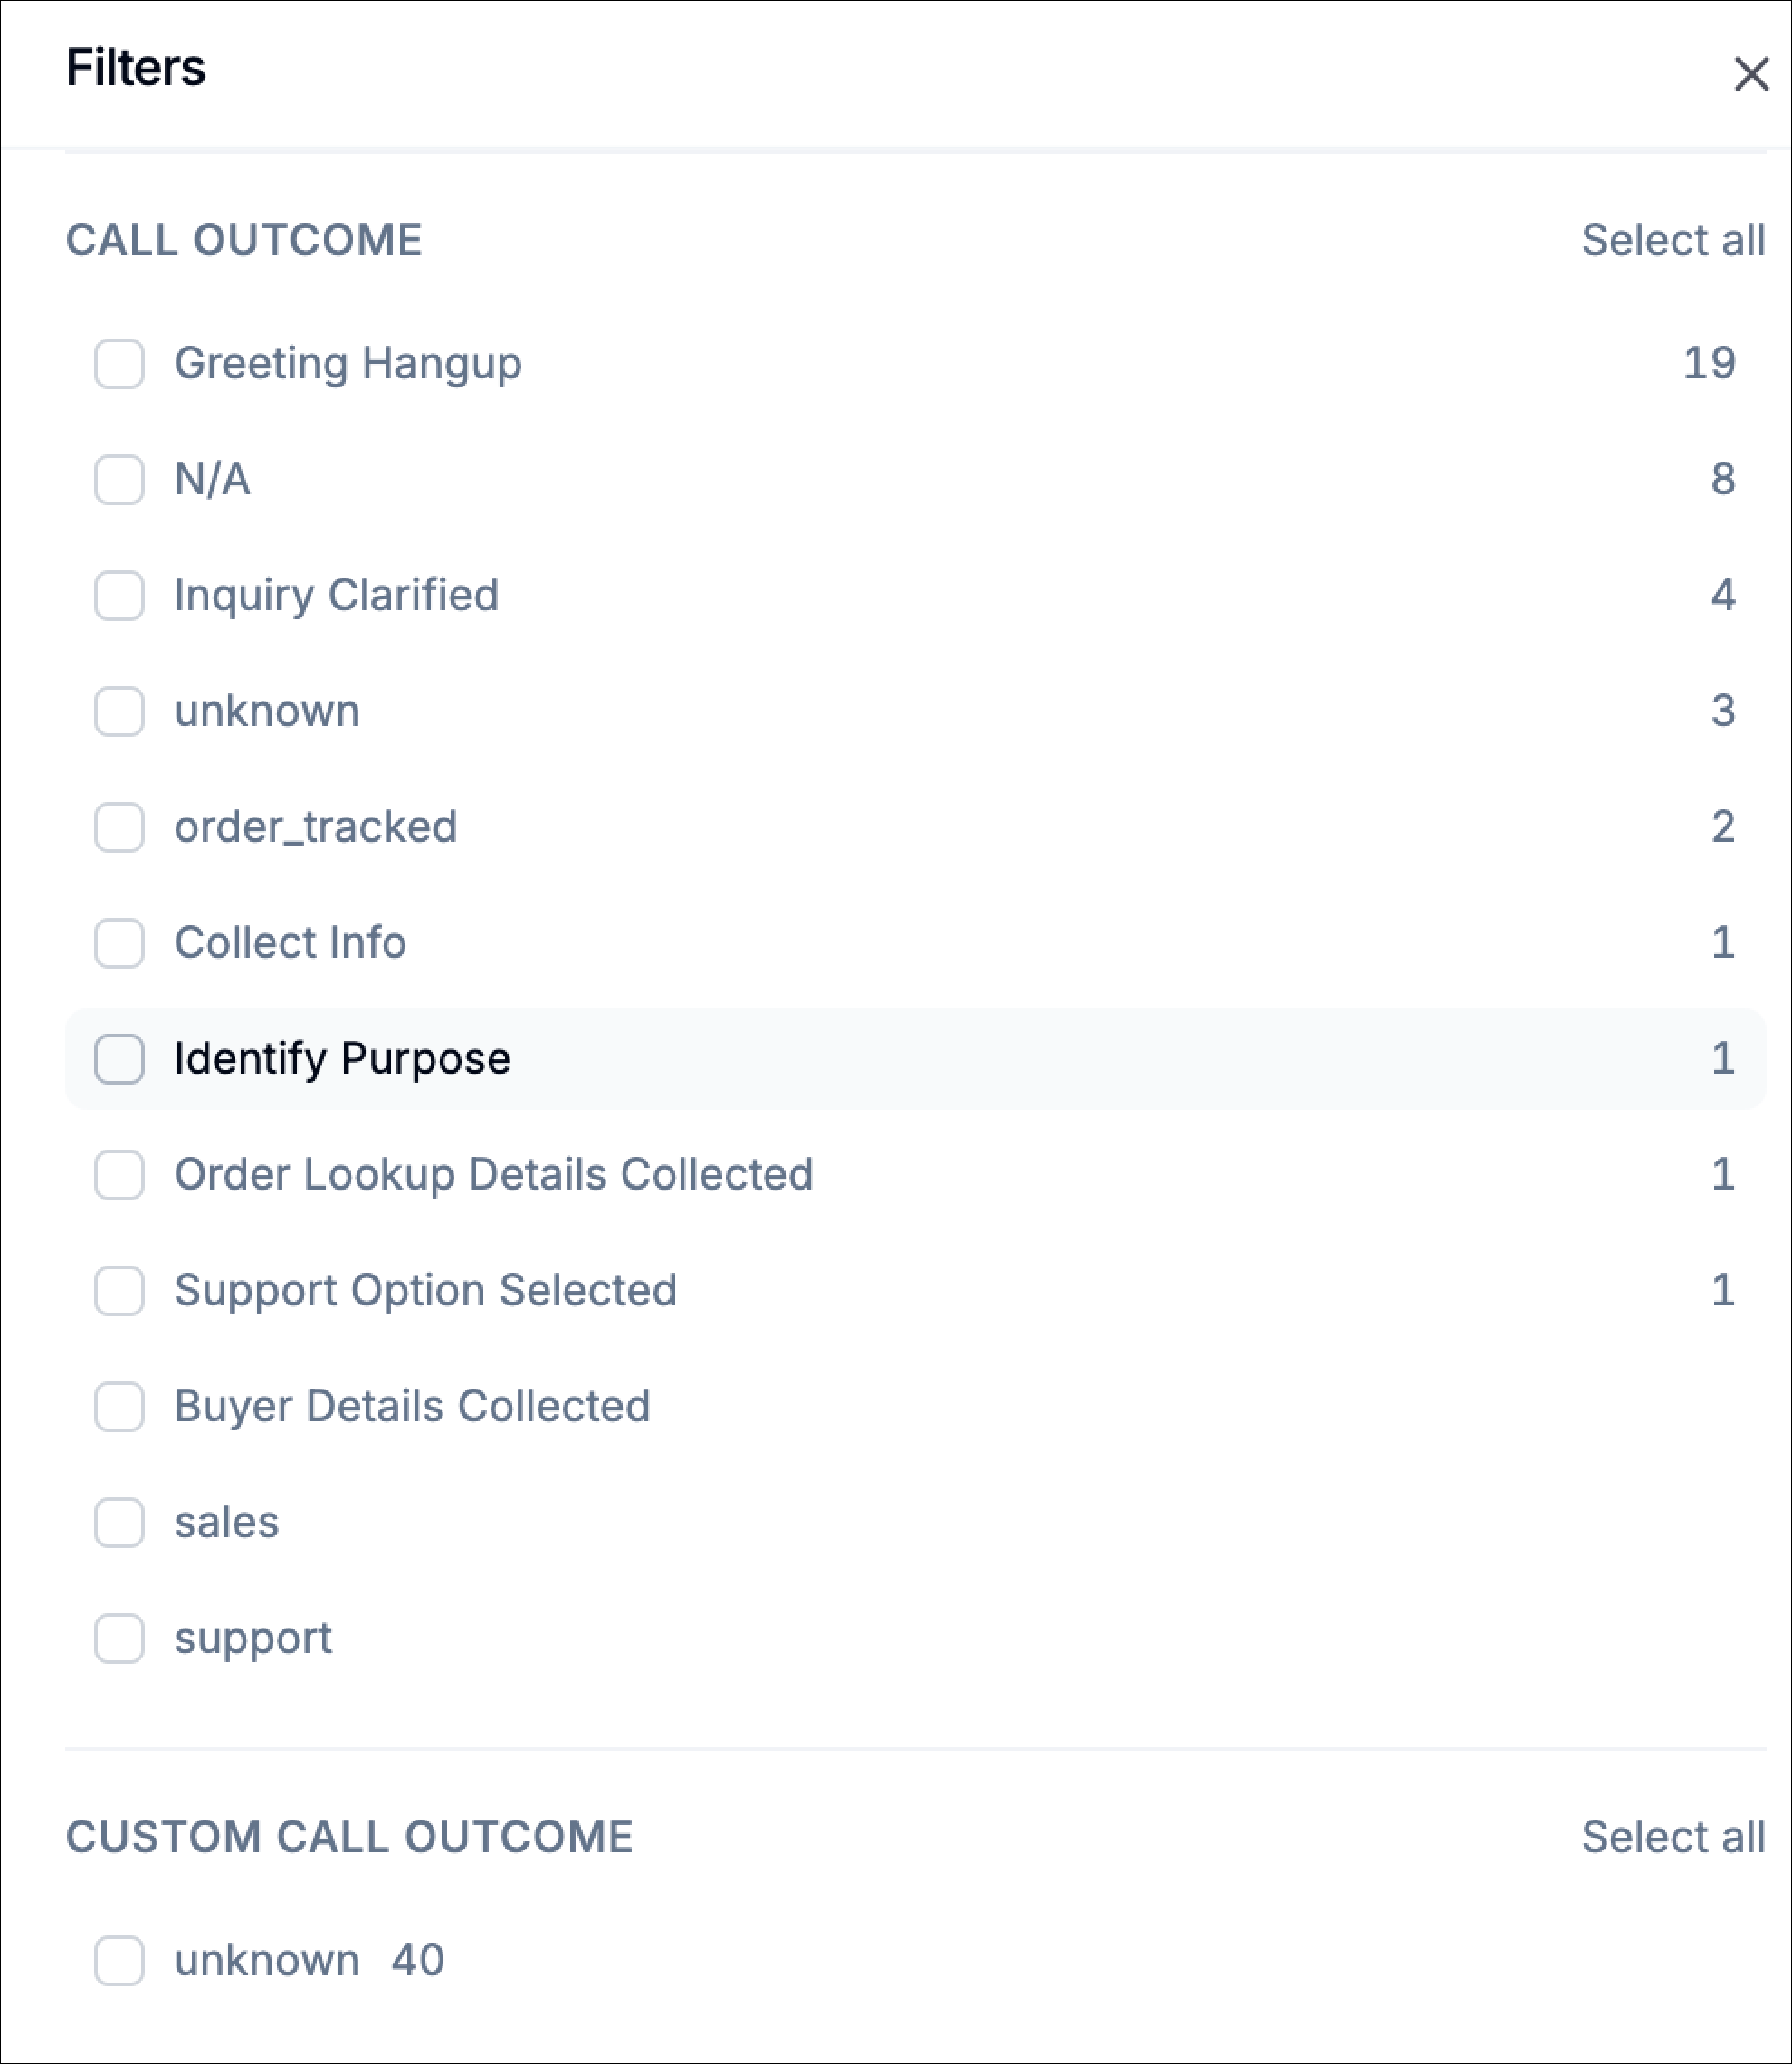
Filter (call-level filters)
The filters panel allows you to narrow down the set of calls displayed in the call paths view. By applying filters, you can focus on specific call behaviors, time ranges, outcomes, or call characteristics. This is especially useful when you want to investigate patterns such as short calls, after-hours activity, calls that ended unexpectedly, or calls related to specific customer intents. To open the panel, click Filters in the top-right corner of the page. After selecting the desired criteria, click Apply to refresh the view using only the calls that match the selected filters. Duration The duration filter lets you focus on calls based on how long they lasted. You can use the preset options:- < 1 min – very short calls, often useful for identifying greeting hang-ups or abandoned calls
- 1–5 min – medium-length interactions that typically represent quick inquiries
- > 5 min – longer conversations that may indicate complex issues or detailed support interactions
- All Days – includes calls from the entire week
- Weekdays – Monday through Friday
- Weekend – Saturday and Sunday
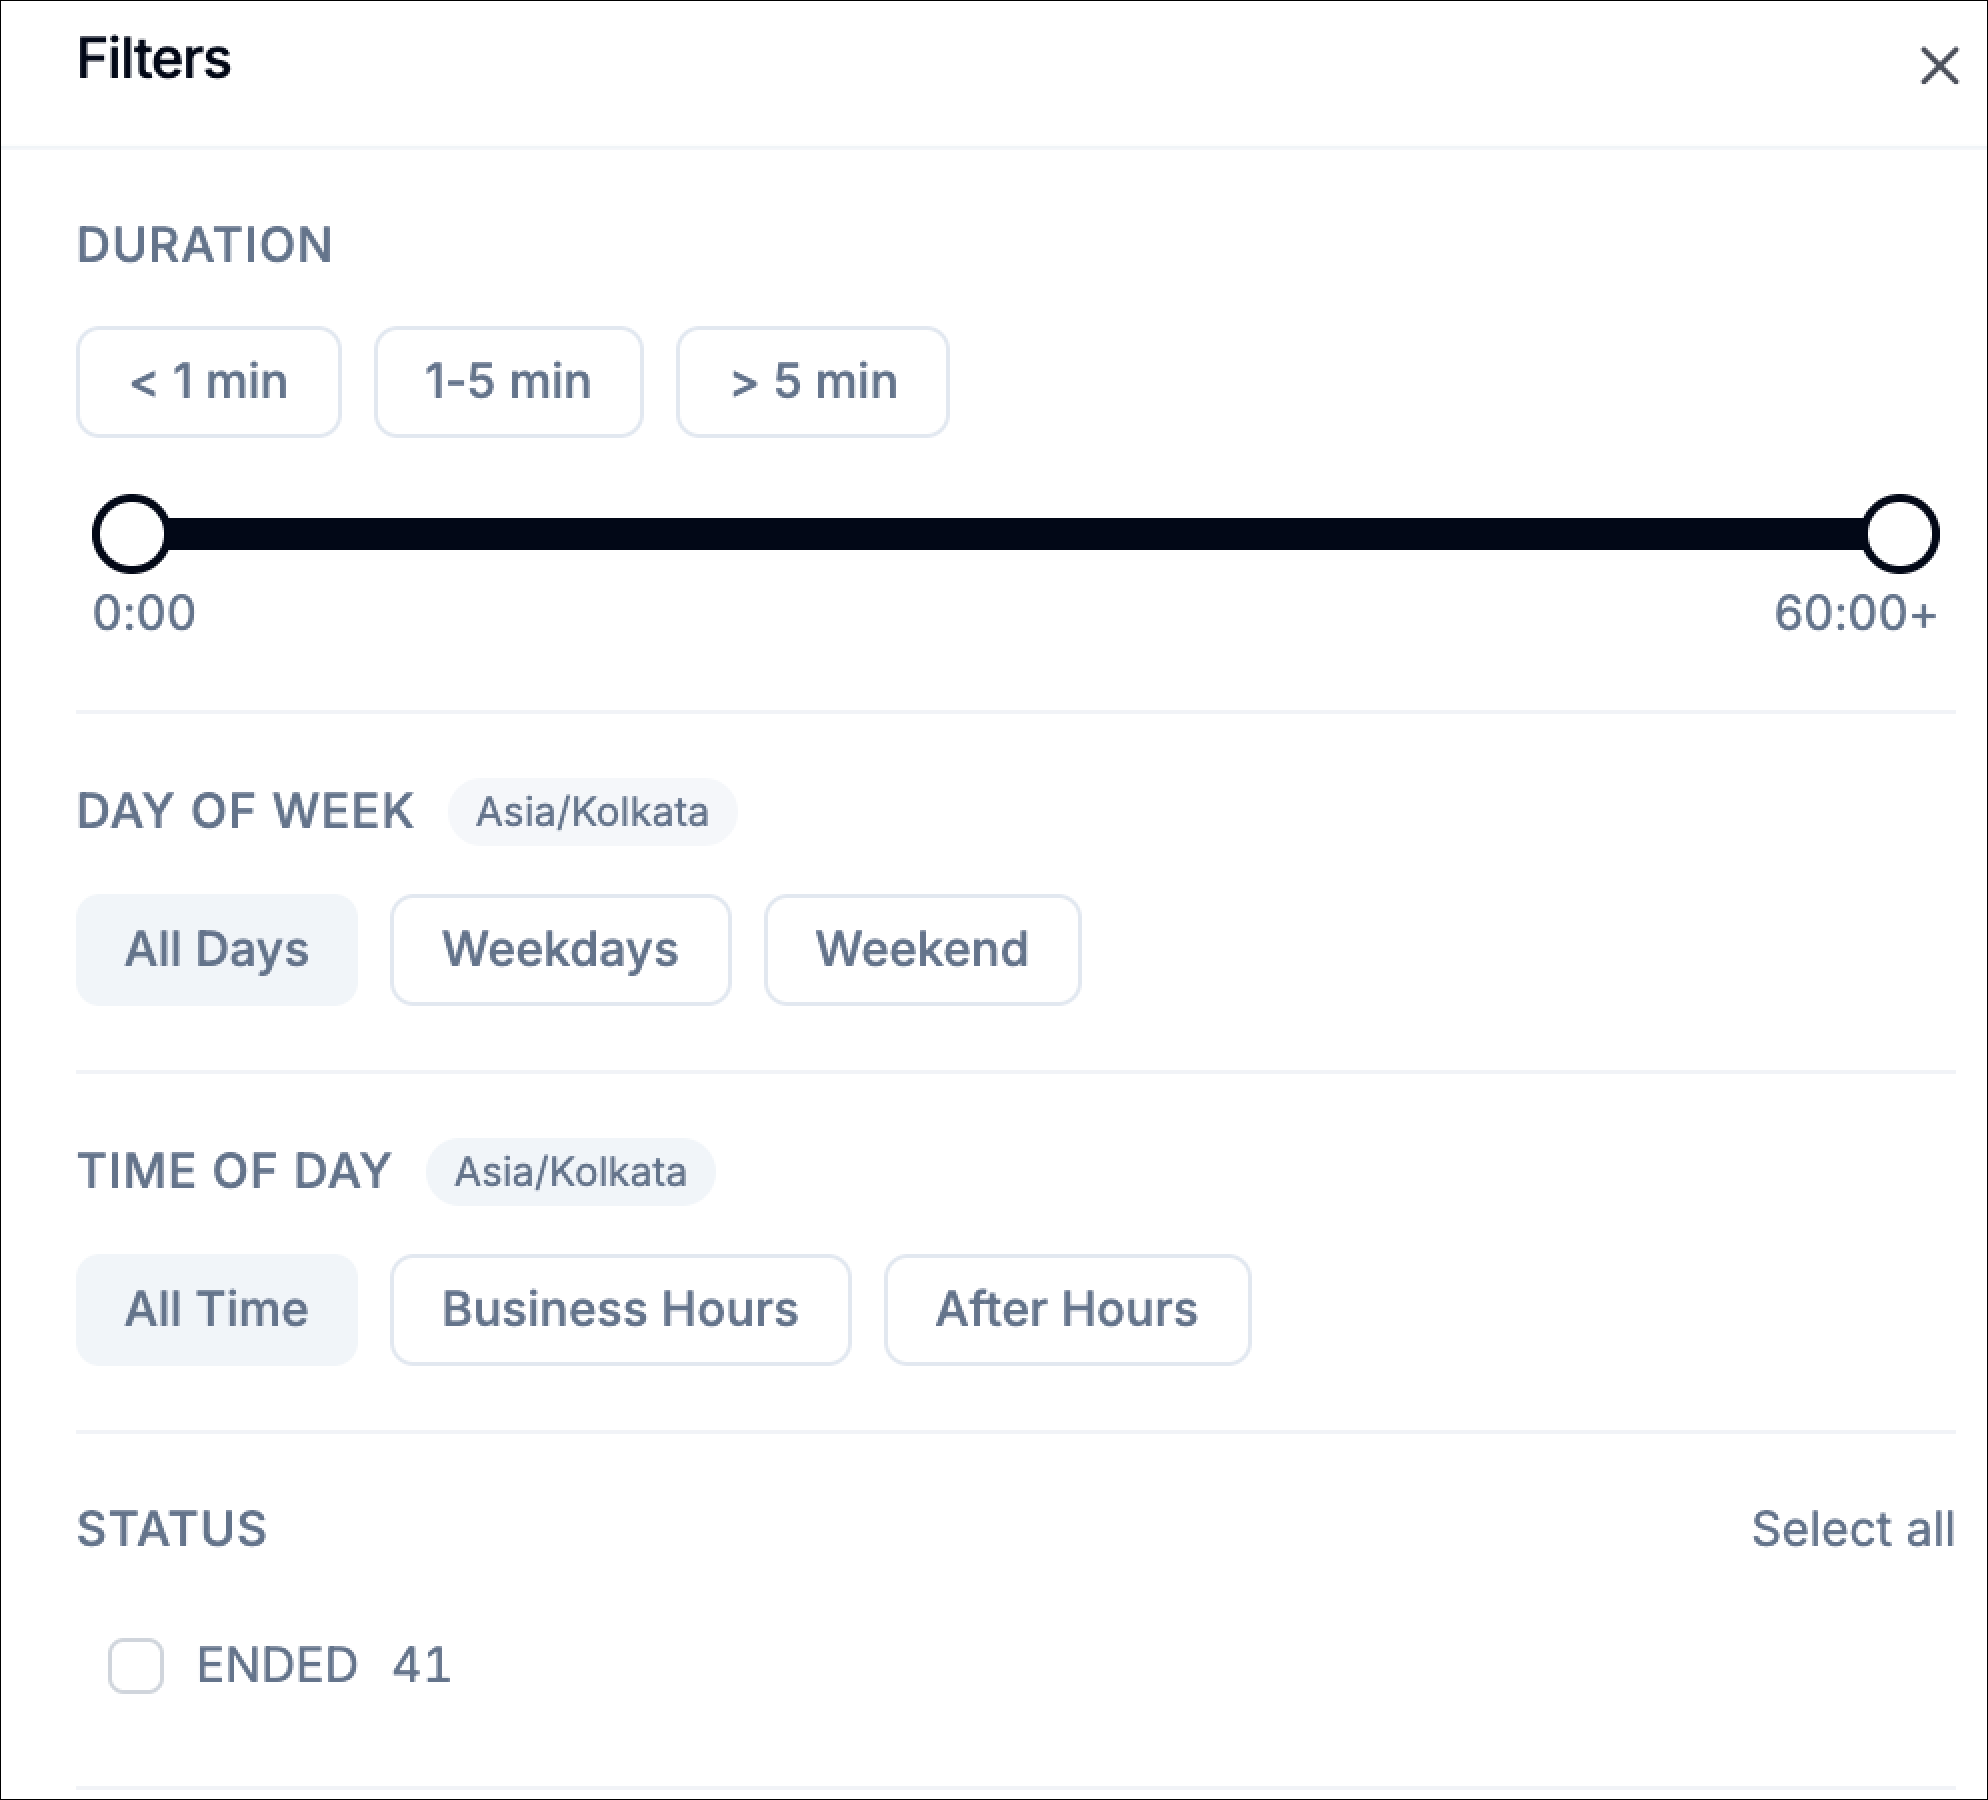
- All Time – includes calls from any time of day
- Business Hours – commonly used working hours (default 9:00 AM – 5:00 PM)
- After Hours – calls that occur outside standard working hours
- webCall – calls initiated from a web interface
- inboundPhoneCall – calls coming directly from a phone number

- Neutral – standard interactions without strong sentiment
- Positive – conversations where the caller expressed satisfaction
1
Click Apply to update the Call Paths visualization using only the matching calls.
2
Click Reset to clear all filter selections.
3
Click Cancel to close the panel without applying changes.
Switching workflows
Along the bottom of the page, you’ll see the available workflows.- Click a workflow name to load its call path diagram.
- The page updates the canvas to show the selected workflow’s pathing and volumes.
Paths (connections)
The connections between blocks represent transitions callers took between steps. Typically:- Thicker / more prominent paths indicate higher call volume.
- End nodes on the right often represent where calls concluded (for example: Customer Ended Call, Silence Timeout, Assistant Ended Call).
Nodes (blocks)
Each node (block) in Call Path represents a step in your workflow. When you click a node, Phonely opens a right-side panel that lets you inspect what the node is, what it’s configured to do, and how calls behaved at that step. What you see depends on the node typeStart node
The Start node is the entry point for the flow. Currently, it does not show additional node-level details in the panel.Action nodes
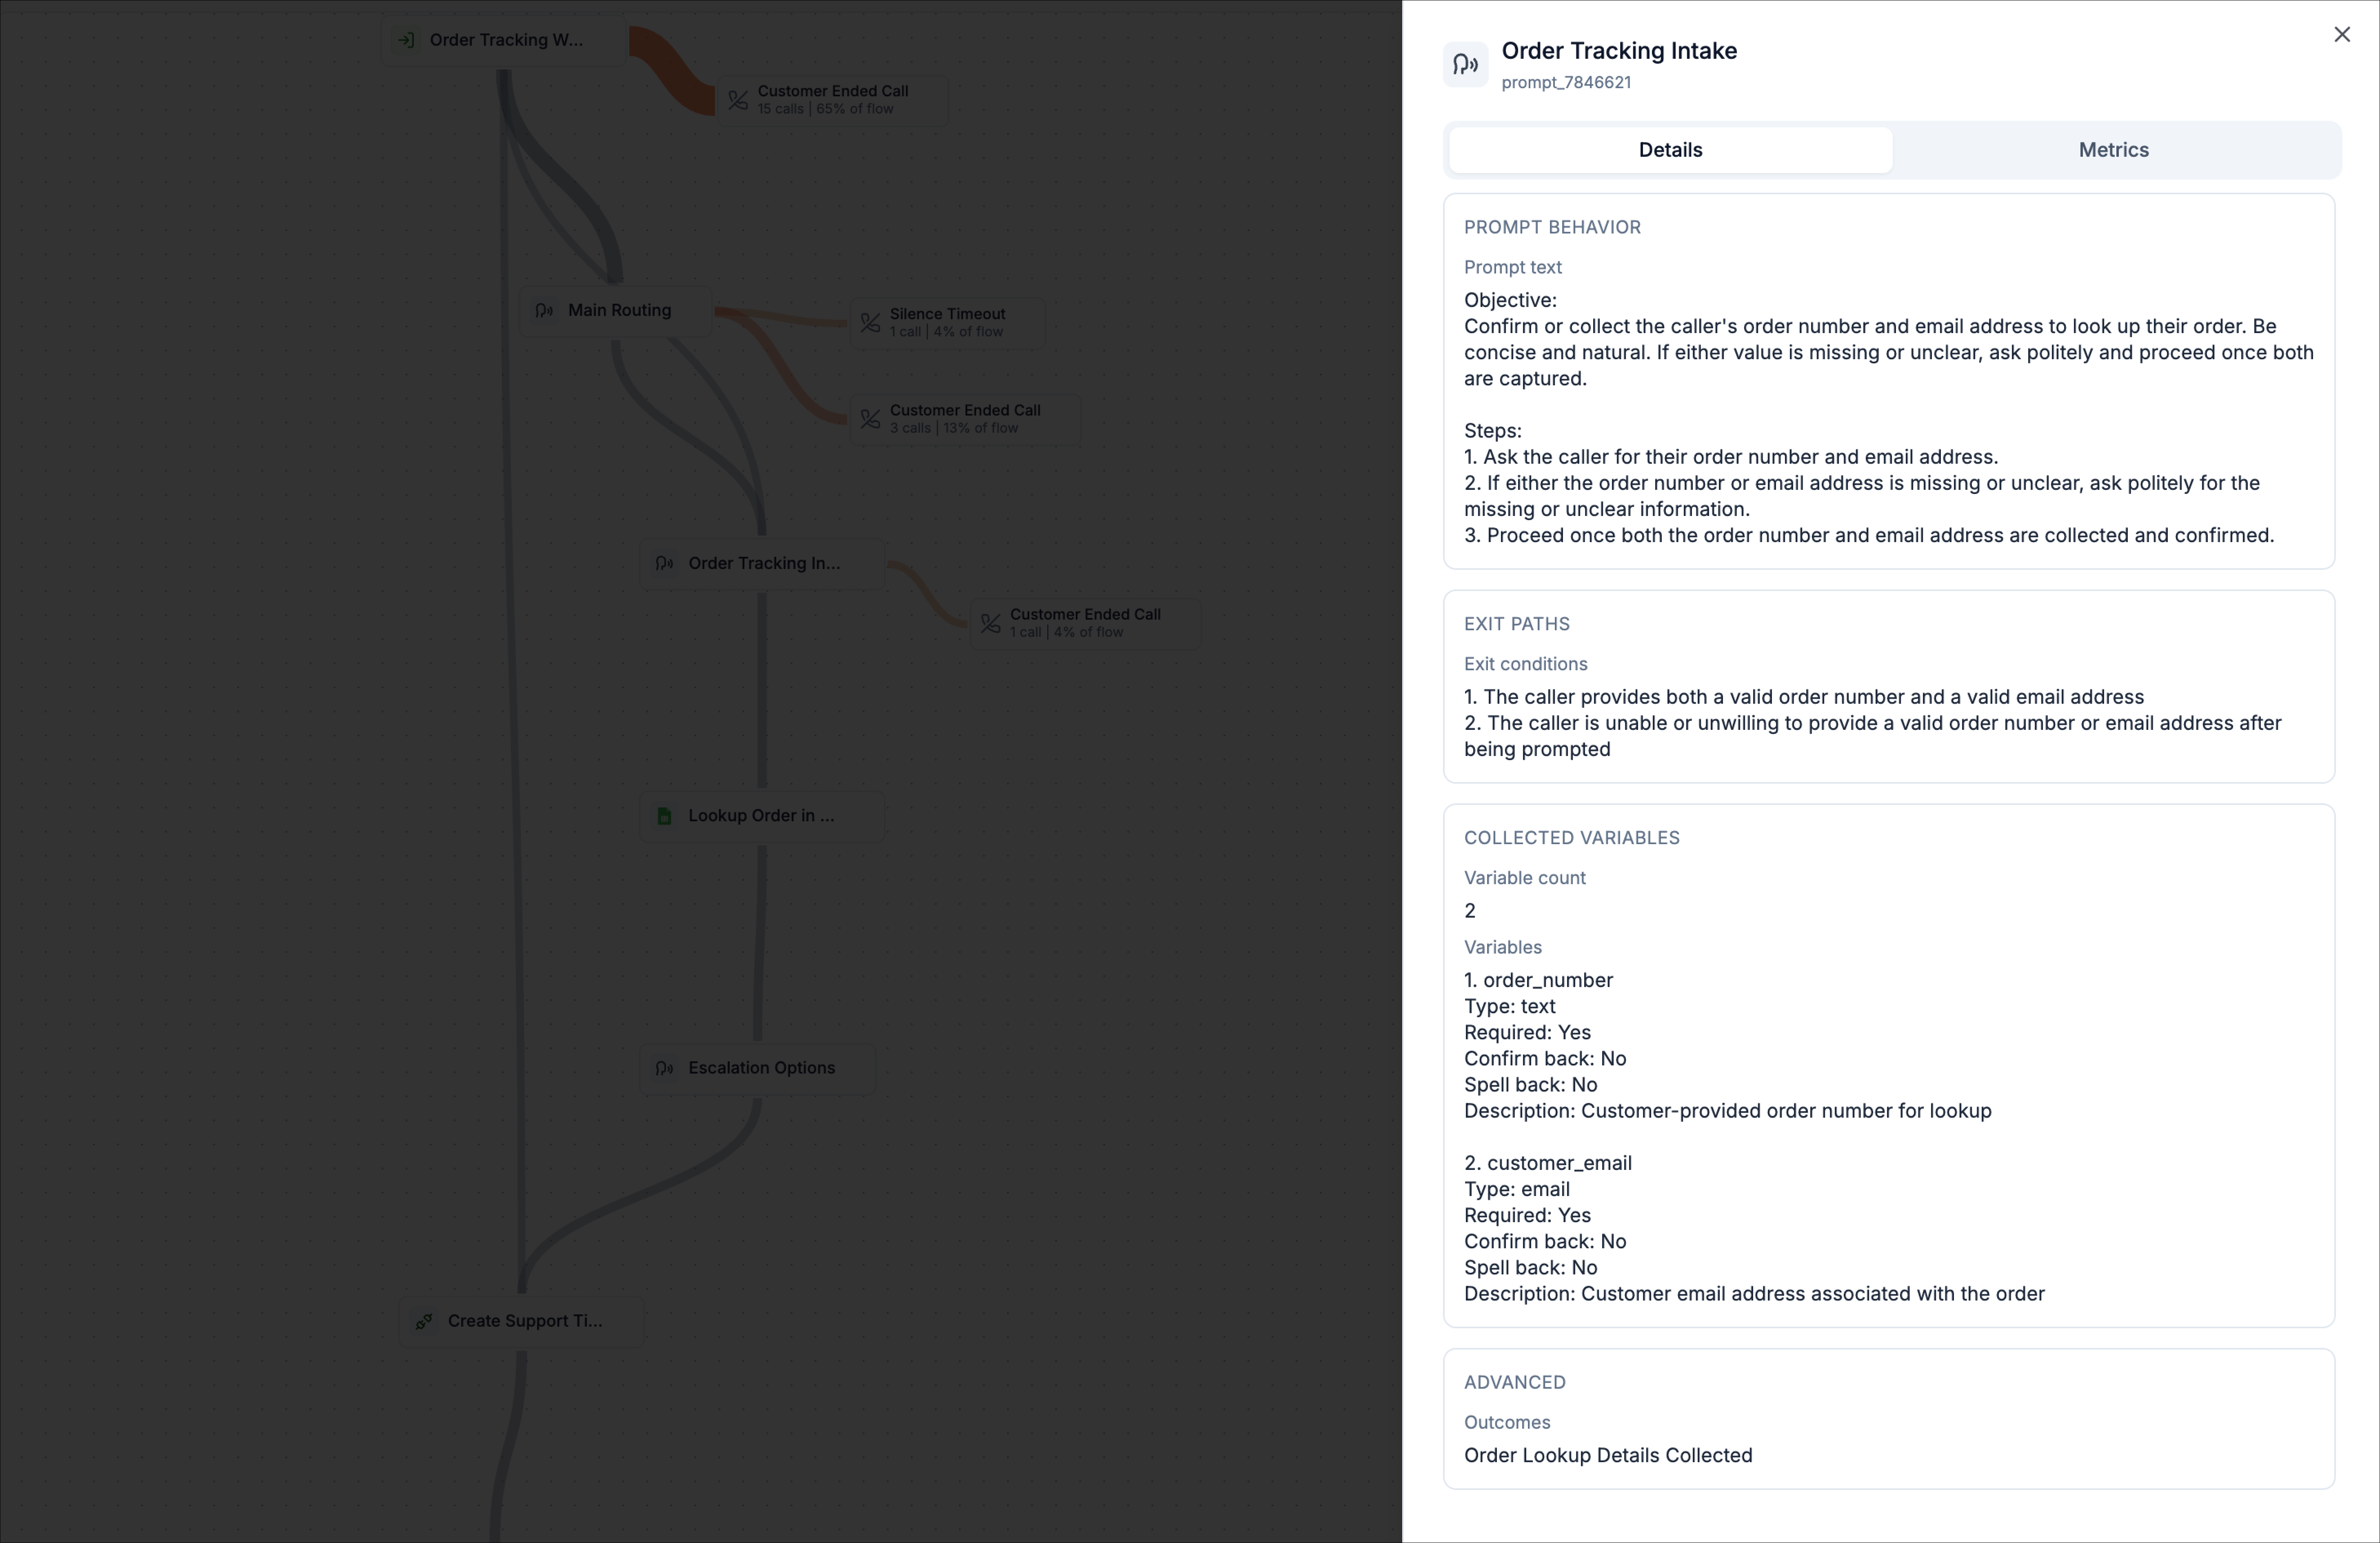
Action nodes show the most detail because they represent an actual workflow step (for example: collect details, route, API request, transfer, etc.). When you click an action node a right-side panel opens with two tabs: Details and Metrics. Together, these tabs answer two different questions:- Details = What is this node configured to do (right now)?
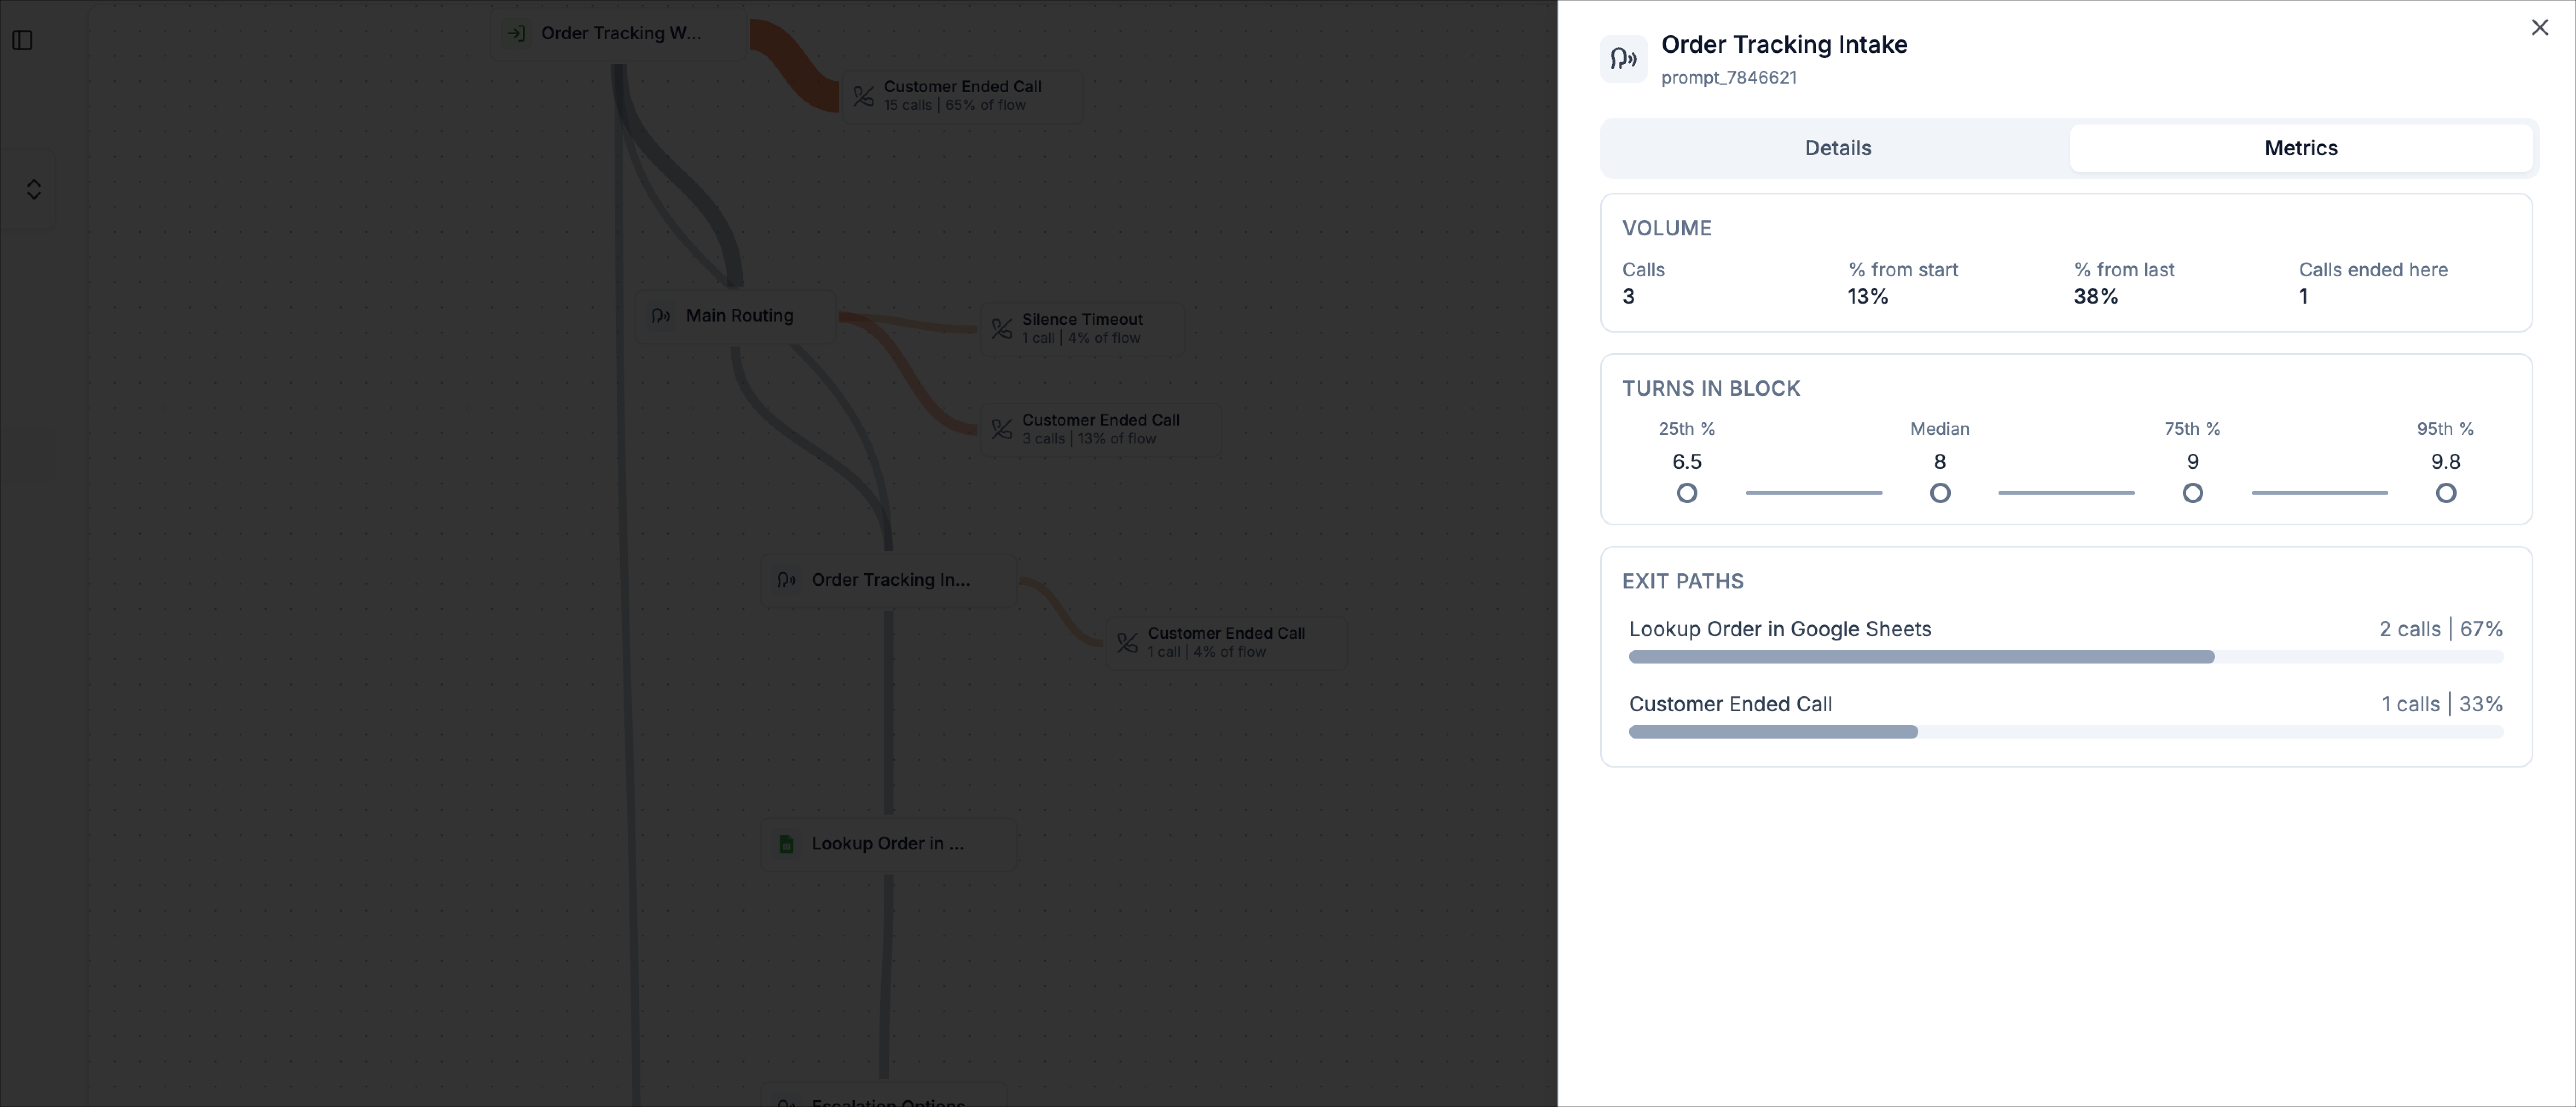
- Metrics = What actually happened here in the selected calls?
1
Prompt behavior
Objective: what the node is trying to achieve in the conversationSteps: the intended sequence of prompts/actions inside the node
2
Exit paths
Exit conditions: the conditions that determine how the node completes and where the call can go next (for example, “caller provides both order number and email” vs “caller can’t provide valid details”)
3
Collected variables
A variable count plus a list of variables this node collects (for example
order_number, customer_email)Per-variable metadata like:- Type (text, email, etc.)
- Required (Yes/No)
- Confirm back / Spell back (Yes/No)
- Description (what the variable represents)
4
Exit paths
Exit conditions: the conditions that determine how the node completes and where the call can go next (for example, “caller provides both order number and email” vs “caller can’t provide valid details”)
5
Advanced
Any additional configuration tied to the node, such as outcomes that may be tagged when the node completes (for example, “Order Lookup Details Collected”)
1
Volume
This section shows how much traffic reached the node and how it relates to the rest of the flow:
- Calls: number of calls that reached this node
- % from start: share of all calls in the flow that made it to this node
- % from last: share of calls from the previous node that continued into this node
- Calls ended here: number of calls that terminated at this node (drop-off point)
2
Turns in block
This section shows how long conversations tend to stay in this node, measured in interaction turns:
- 25th percentile: a “fast path” baseline (calls that moved through quickly)
- Median: the typical number of turns in this node
- 75th percentile: calls that needed more back-and-forth than usual
- 95th percentile: outliers where callers spent the most time here
3
Exit paths
This section shows where calls went after this node, including both the distribution and counts:
- Each exit path lists the next step (for example, “Lookup Order in Google Sheets”)
- It also shows call count and percentage for that path (for example, “2 calls | 67%”)
- If calls ended at this node, you’ll see an end outcome listed as an exit path (for example, “Customer Ended Call”)
End nodes
End nodes summarize where calls terminate. When you click an end node, the panel shows simple call volume analytics so you can quickly understand how many calls ended there and how significant that end point is relative to the rest of the flow.