> ## Documentation Index
> Fetch the complete documentation index at: https://docs.phonely.ai/llms.txt
> Use this file to discover all available pages before exploring further.
# Data Tables
> Build custom table views to group, measure, and compare call performance metrics across your agents.
The **Data Tables** tab in Performance lets you create saved table views that group calls and calculate metrics for each group. Instead of reading a single chart, you define the grouping and the formulas -- Phonely handles the aggregation.
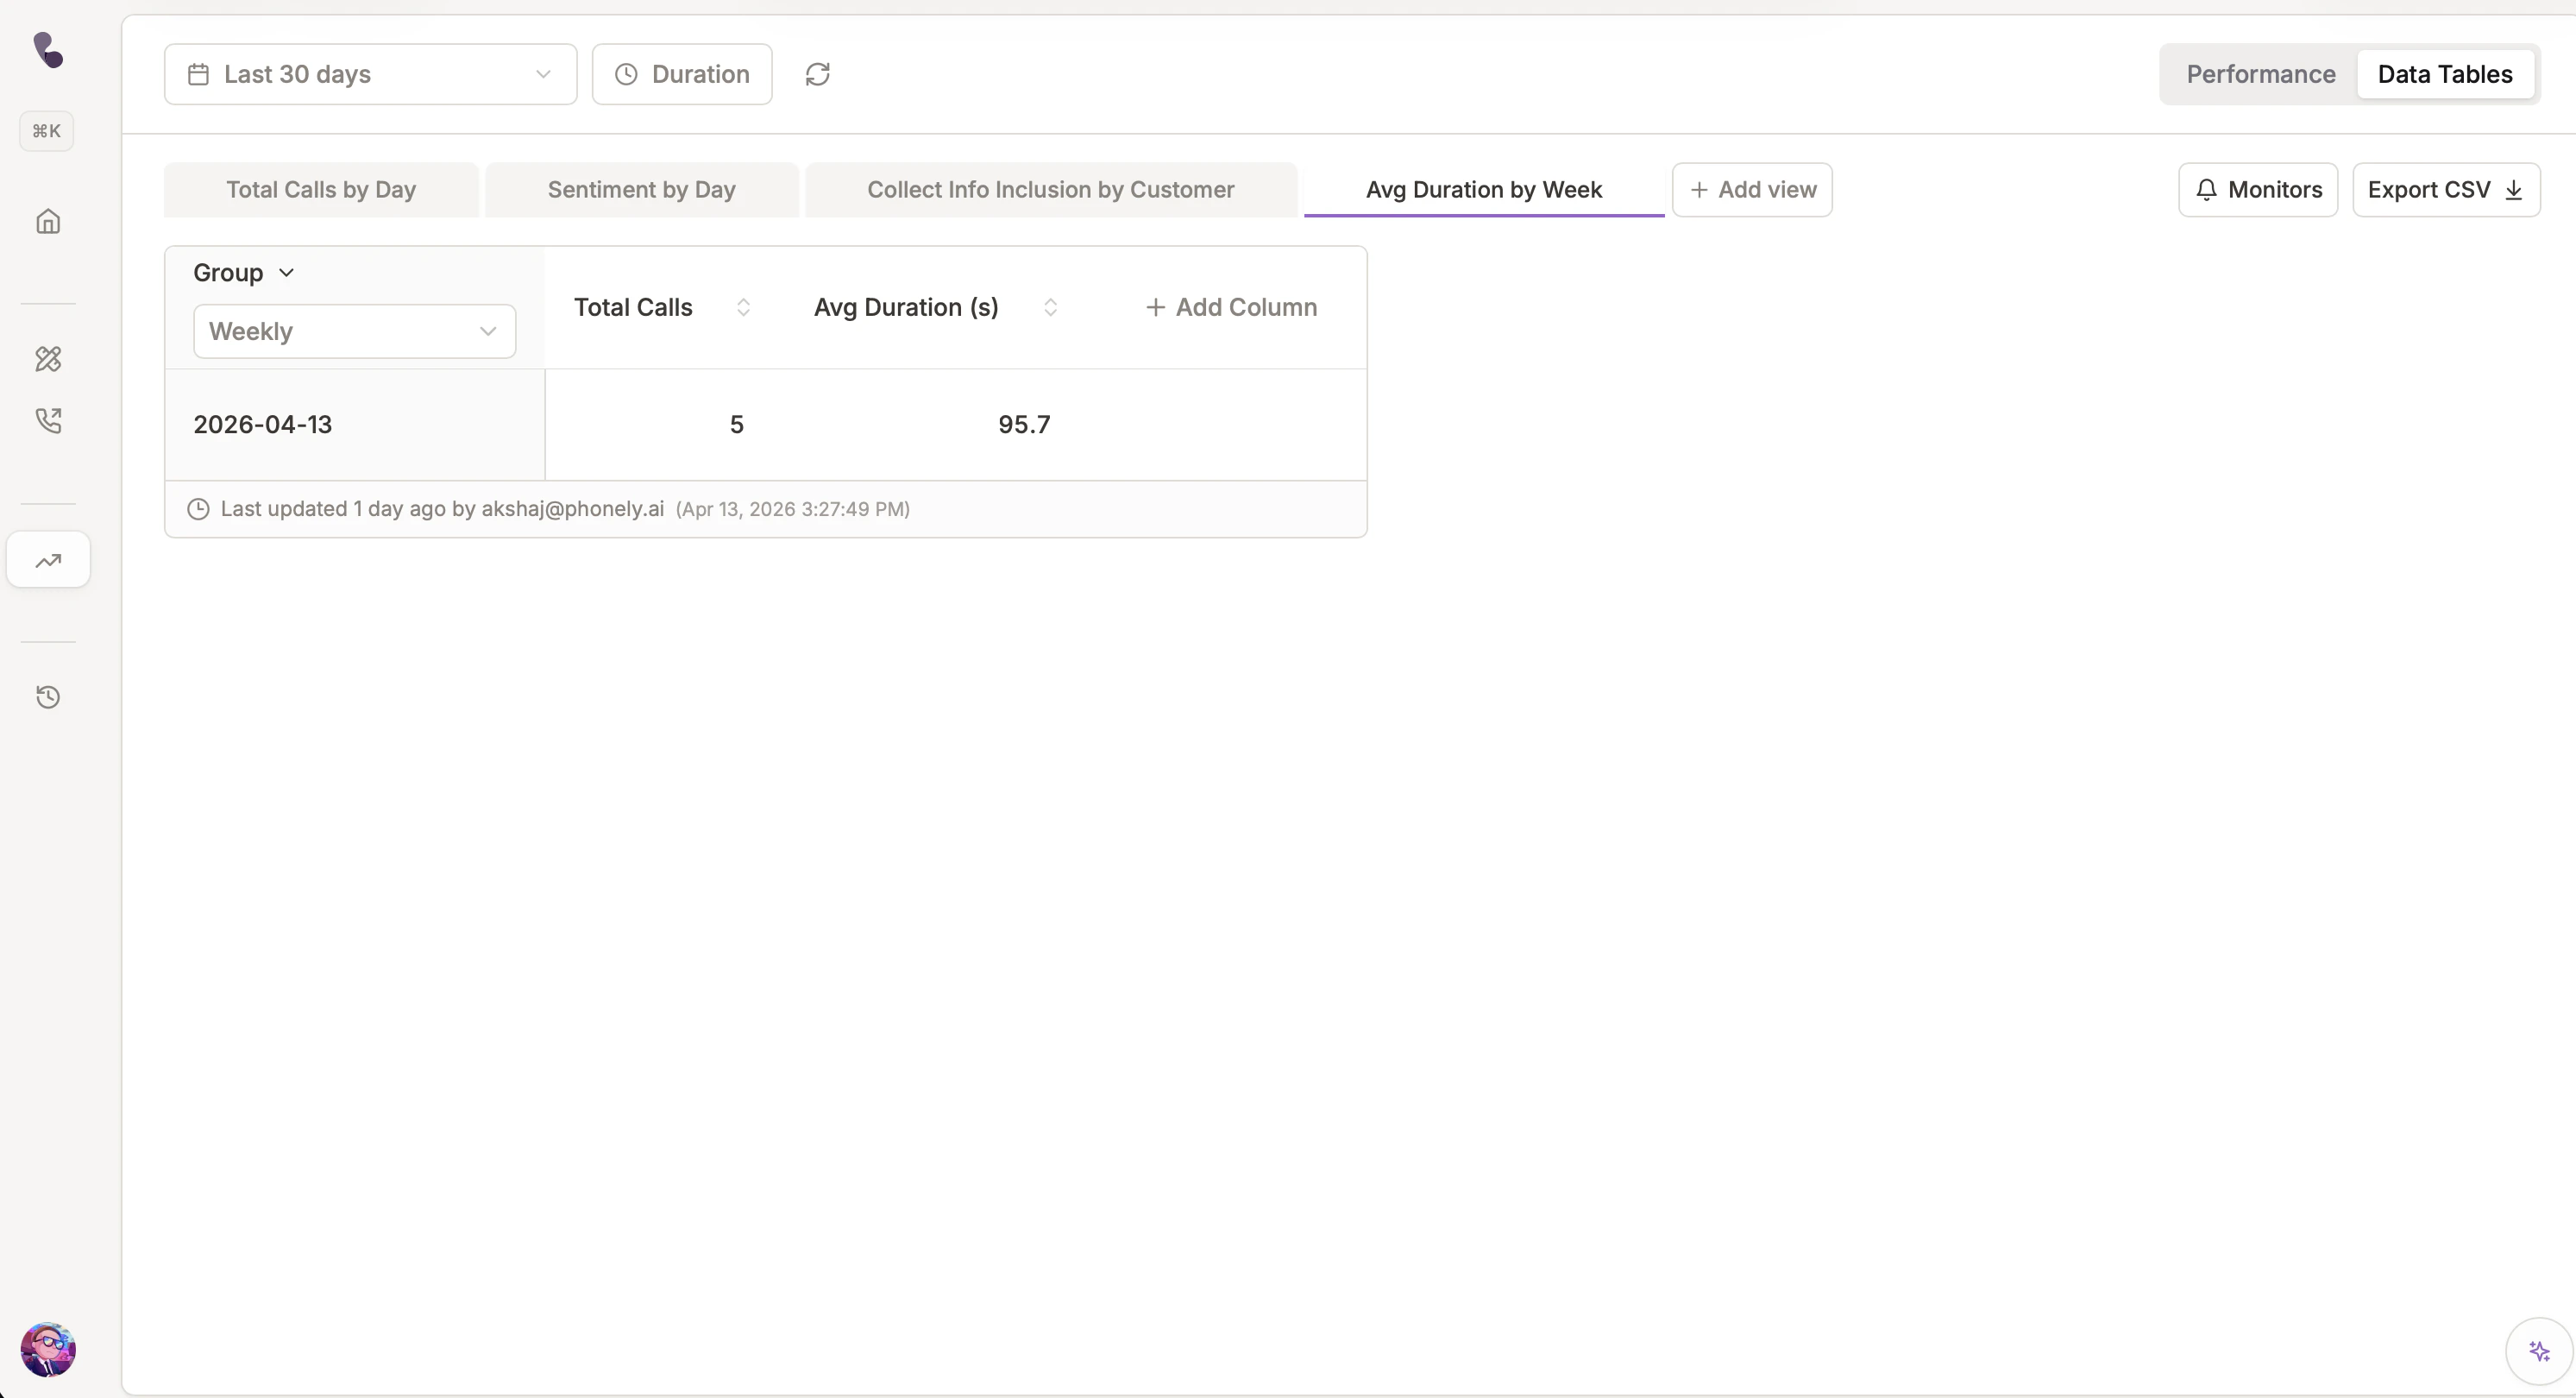 Data Tables is one of two tabs inside the **Performance** page. The other is the standard Performance charts view. Switch between them using the toggle in the top-right corner.
## Quick Answers Data Tables Can Give You
How many calls came in today, this week, or this month? Which prompt version receives the most traffic?
What percentage of calls result in an appointment booked? Which outcomes appear most often?
What is the negative sentiment rate by day? Are specific customer phone numbers consistently unhappy?
How often do calls end due to silence timeout or max duration? What is the voicemail rate by agent phone number?
## What Is a View?
A **view** is a saved table configuration. Each view contains:
| Component | Purpose |
| :----------------- | :--------------------------------------------------------------- |
| **Name** | Label shown as the tab (e.g., "Daily Success Rate") |
| **Description** | Optional notes explaining the view's purpose |
| **Grouping** | How rows are split (by time, phone number, or prompt version) |
| **Metric columns** | One or more formulas that calculate a value per group |
| **Sort** | Which column to sort by and in which direction |
| **Targets** | Optional thresholds for each metric to flag rows that miss a KPI |
You can create multiple views per agent. Each appears as a tab you can switch between instantly.
If an agent has no views yet, Phonely automatically creates a default **"Total Calls by Day"** view to get you started.
## Getting There
From the left sidebar, go to **Analytics** then **Performance**.
In the top-right, toggle from **Performance** to **Data Tables**.
Click any view tab, or press **+ Add view** to create a new one. Use the date range selector at the top to control the time window.
## How the Page Is Organized
The data tables page is built around a saved view. At the top you see the date range and any global performance selector. Below that is the main data table with the active view tab, an **Add view** button, the **Group** selector, and the metric columns.
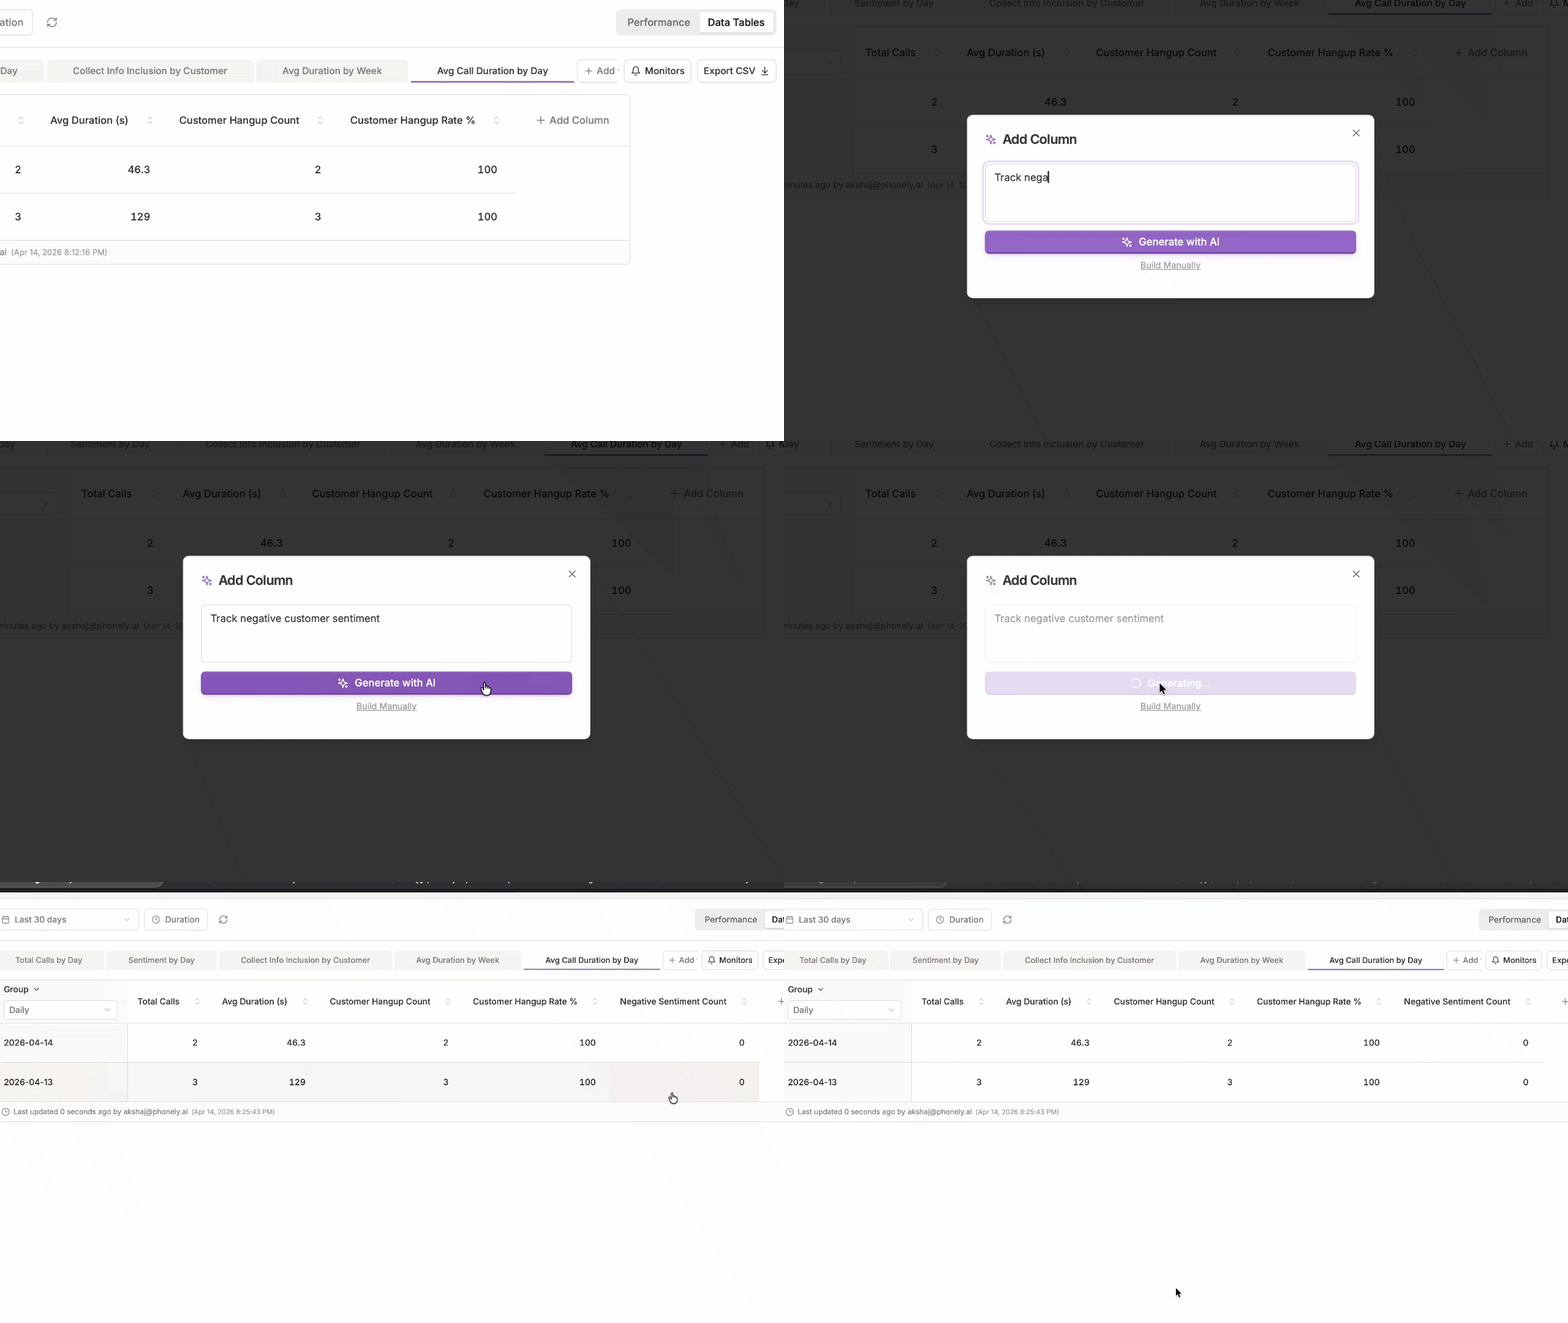
Inside the table, the first column is the grouping column (e.g., dates or prompt versions). The remaining columns are metrics. An **Add Column** button in the header lets you create new metrics inline.
## Grouping Options
The **Group** selector determines how rows are split. Choose one:
| Grouping | Row Represents | Best For |
| :----------------- | :--------------------------------------- | :----------------------------- |
| **Every 15 min** | A 15-minute time bucket | Intraday spikes and patterns |
| **Hourly** | One hour | Hourly load analysis |
| **Daily** | One calendar day | Day-over-day trending |
| **Weekly** | One calendar week | Weekly KPI tracking |
| **Monthly** | One calendar month | Month-over-month comparison |
| **Prompt Version** | A specific prompt version (e.g., `v2.4`) | A/B testing prompt changes |
| **Customer Phone** | A unique caller phone number | Per-caller analysis |
| **Agent Phone** | A Phonely phone number | Comparing lines or departments |
Data Tables is one of two tabs inside the **Performance** page. The other is the standard Performance charts view. Switch between them using the toggle in the top-right corner.
## Quick Answers Data Tables Can Give You
How many calls came in today, this week, or this month? Which prompt version receives the most traffic?
What percentage of calls result in an appointment booked? Which outcomes appear most often?
What is the negative sentiment rate by day? Are specific customer phone numbers consistently unhappy?
How often do calls end due to silence timeout or max duration? What is the voicemail rate by agent phone number?
## What Is a View?
A **view** is a saved table configuration. Each view contains:
| Component | Purpose |
| :----------------- | :--------------------------------------------------------------- |
| **Name** | Label shown as the tab (e.g., "Daily Success Rate") |
| **Description** | Optional notes explaining the view's purpose |
| **Grouping** | How rows are split (by time, phone number, or prompt version) |
| **Metric columns** | One or more formulas that calculate a value per group |
| **Sort** | Which column to sort by and in which direction |
| **Targets** | Optional thresholds for each metric to flag rows that miss a KPI |
You can create multiple views per agent. Each appears as a tab you can switch between instantly.
If an agent has no views yet, Phonely automatically creates a default **"Total Calls by Day"** view to get you started.
## Getting There
From the left sidebar, go to **Analytics** then **Performance**.
In the top-right, toggle from **Performance** to **Data Tables**.
Click any view tab, or press **+ Add view** to create a new one. Use the date range selector at the top to control the time window.
## How the Page Is Organized
The data tables page is built around a saved view. At the top you see the date range and any global performance selector. Below that is the main data table with the active view tab, an **Add view** button, the **Group** selector, and the metric columns.
Inside the table, the first column is the grouping column (e.g., dates or prompt versions). The remaining columns are metrics. An **Add Column** button in the header lets you create new metrics inline.
## Grouping Options
The **Group** selector determines how rows are split. Choose one:
| Grouping | Row Represents | Best For |
| :----------------- | :--------------------------------------- | :----------------------------- |
| **Every 15 min** | A 15-minute time bucket | Intraday spikes and patterns |
| **Hourly** | One hour | Hourly load analysis |
| **Daily** | One calendar day | Day-over-day trending |
| **Weekly** | One calendar week | Weekly KPI tracking |
| **Monthly** | One calendar month | Month-over-month comparison |
| **Prompt Version** | A specific prompt version (e.g., `v2.4`) | A/B testing prompt changes |
| **Customer Phone** | A unique caller phone number | Per-caller analysis |
| **Agent Phone** | A Phonely phone number | Comparing lines or departments |
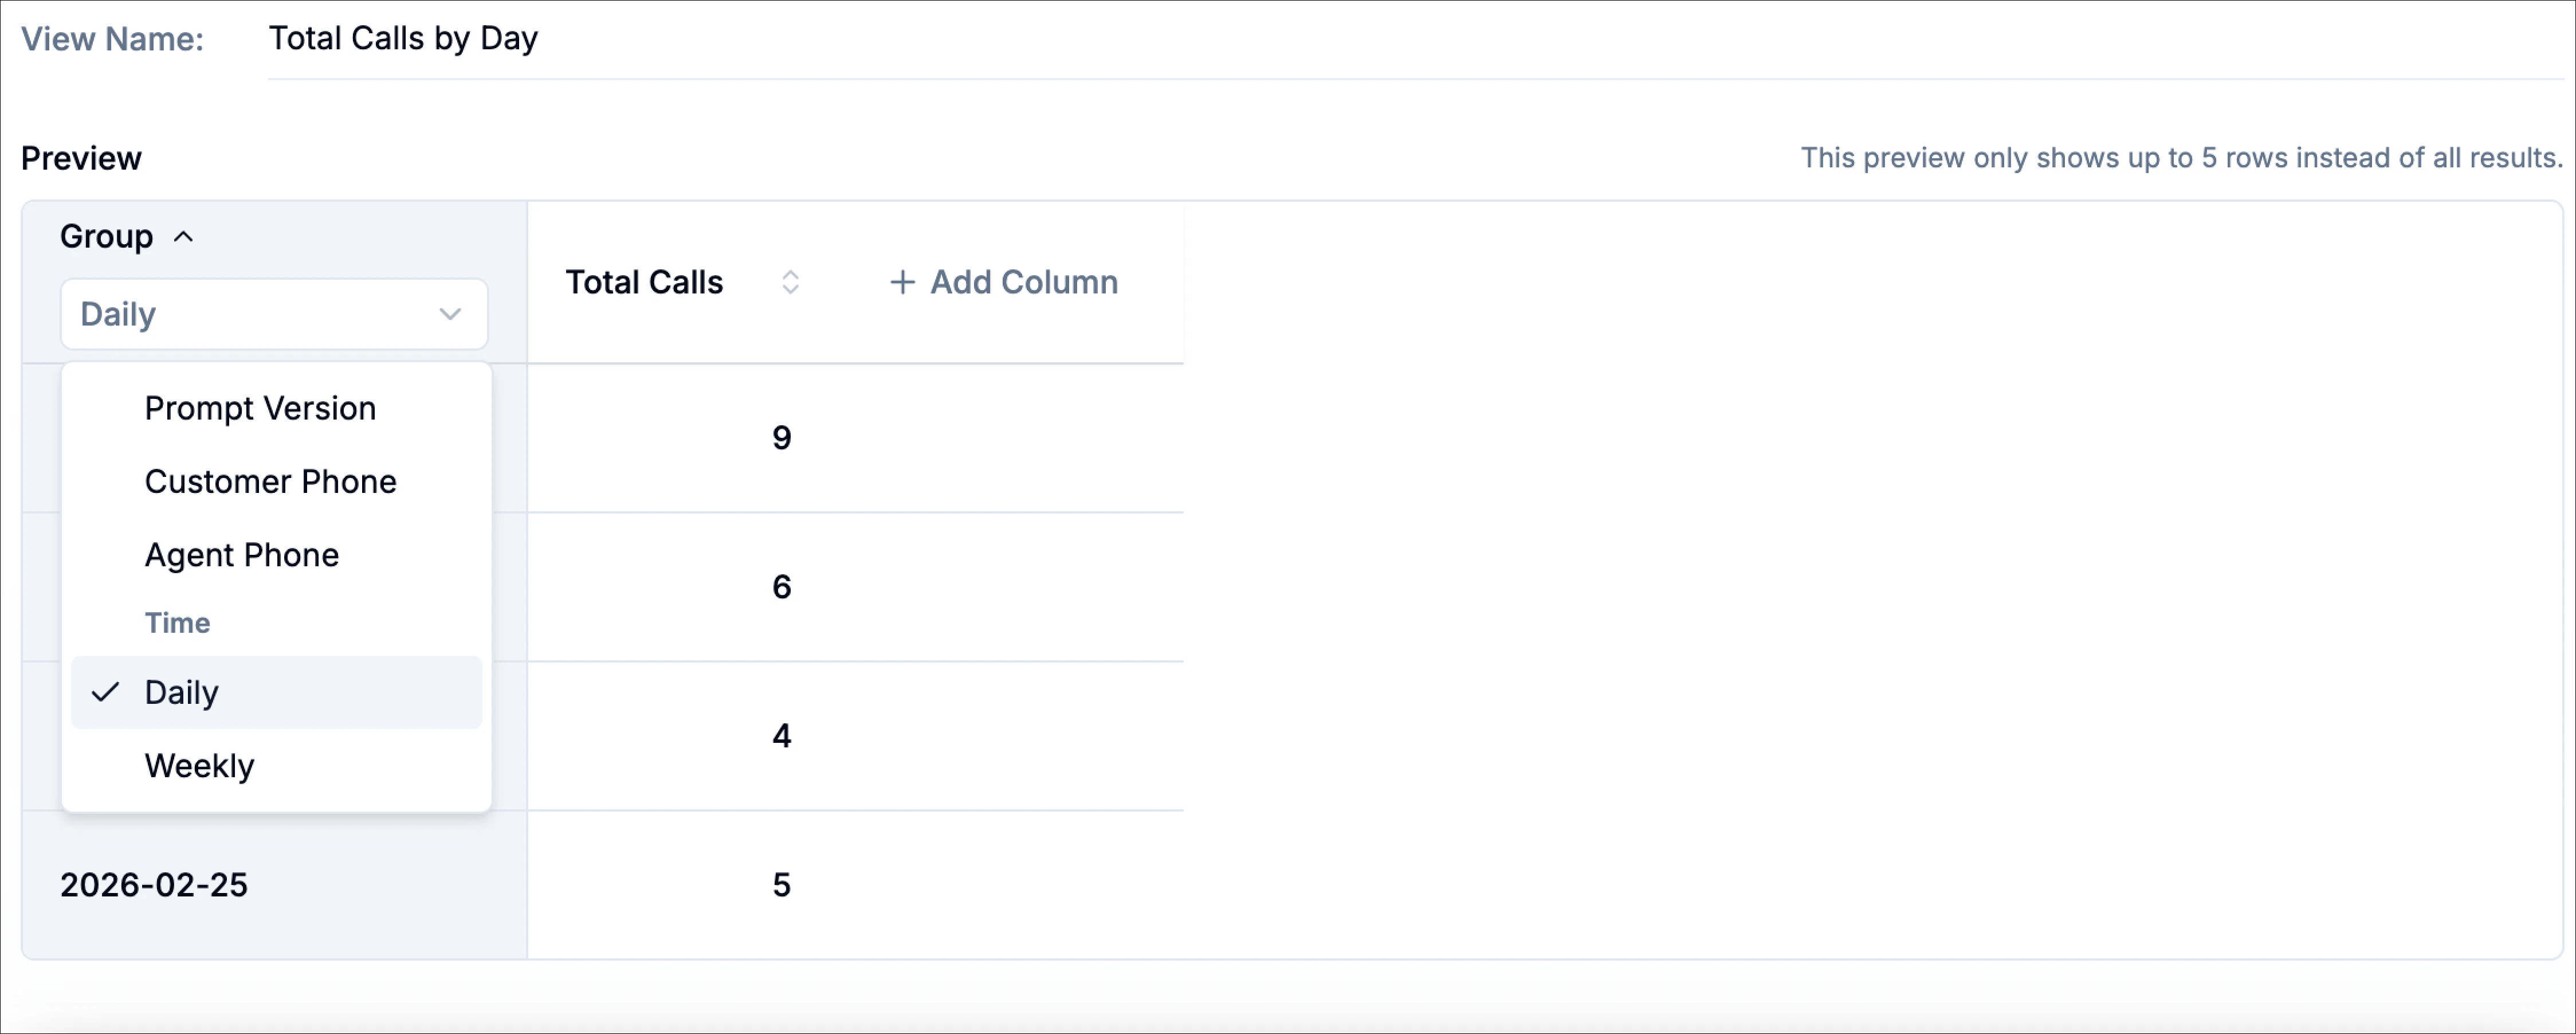 Time granularity options are filtered automatically based on your selected date range. For example, "Monthly" will not appear if the date range is only a few days.
## Creating a View
Click **+ Add view** to open the creation dialog. You have two paths:
Type a natural language description of what you want to see. For example:
> Show daily total calls, success rate, and negative sentiment rate
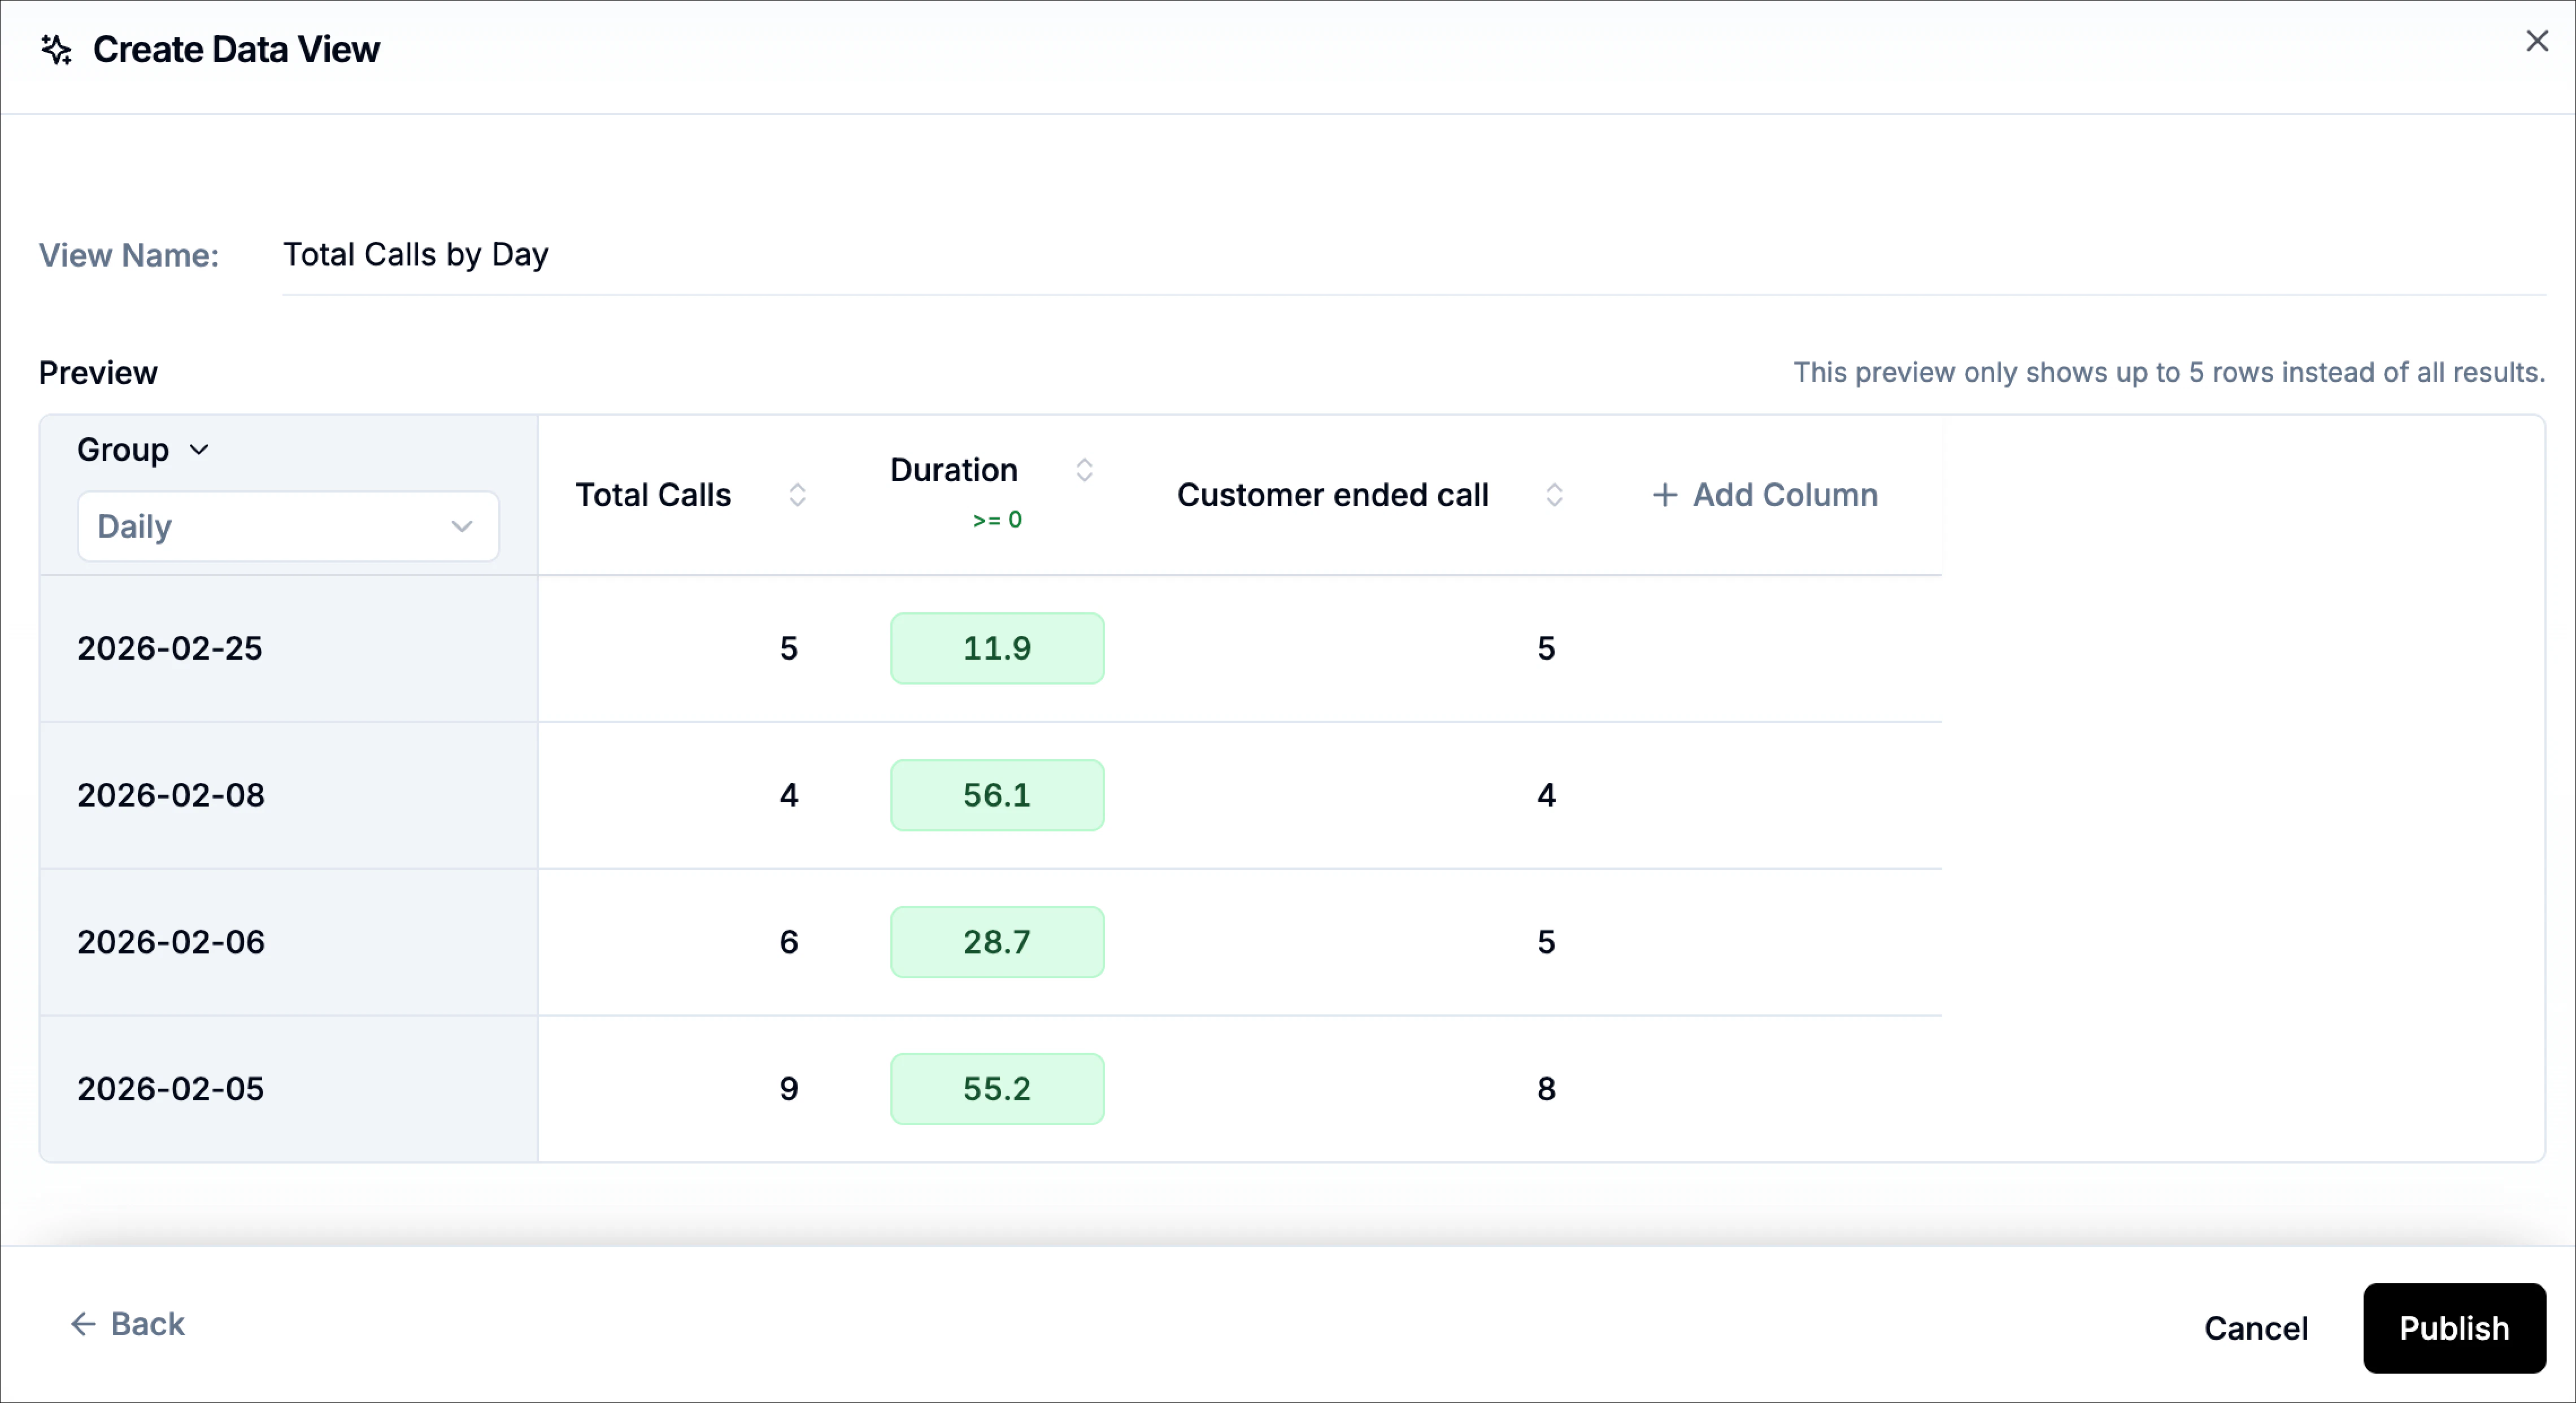
Phonely generates a complete view configuration -- name, grouping, and metric columns -- from your description. A live preview appears so you can review and refine before publishing.
You can also pick from AI-generated suggestion chips like:
* "Show total calls by day"
* "Track appointment booked rate by week"
* "Show avg duration by customer phone number"
* "Compare outcomes by day"
After the preview loads, you can send **follow-up prompts** to iteratively add or replace metrics without starting over.
Click **Build Manually** at the bottom of the dialog.
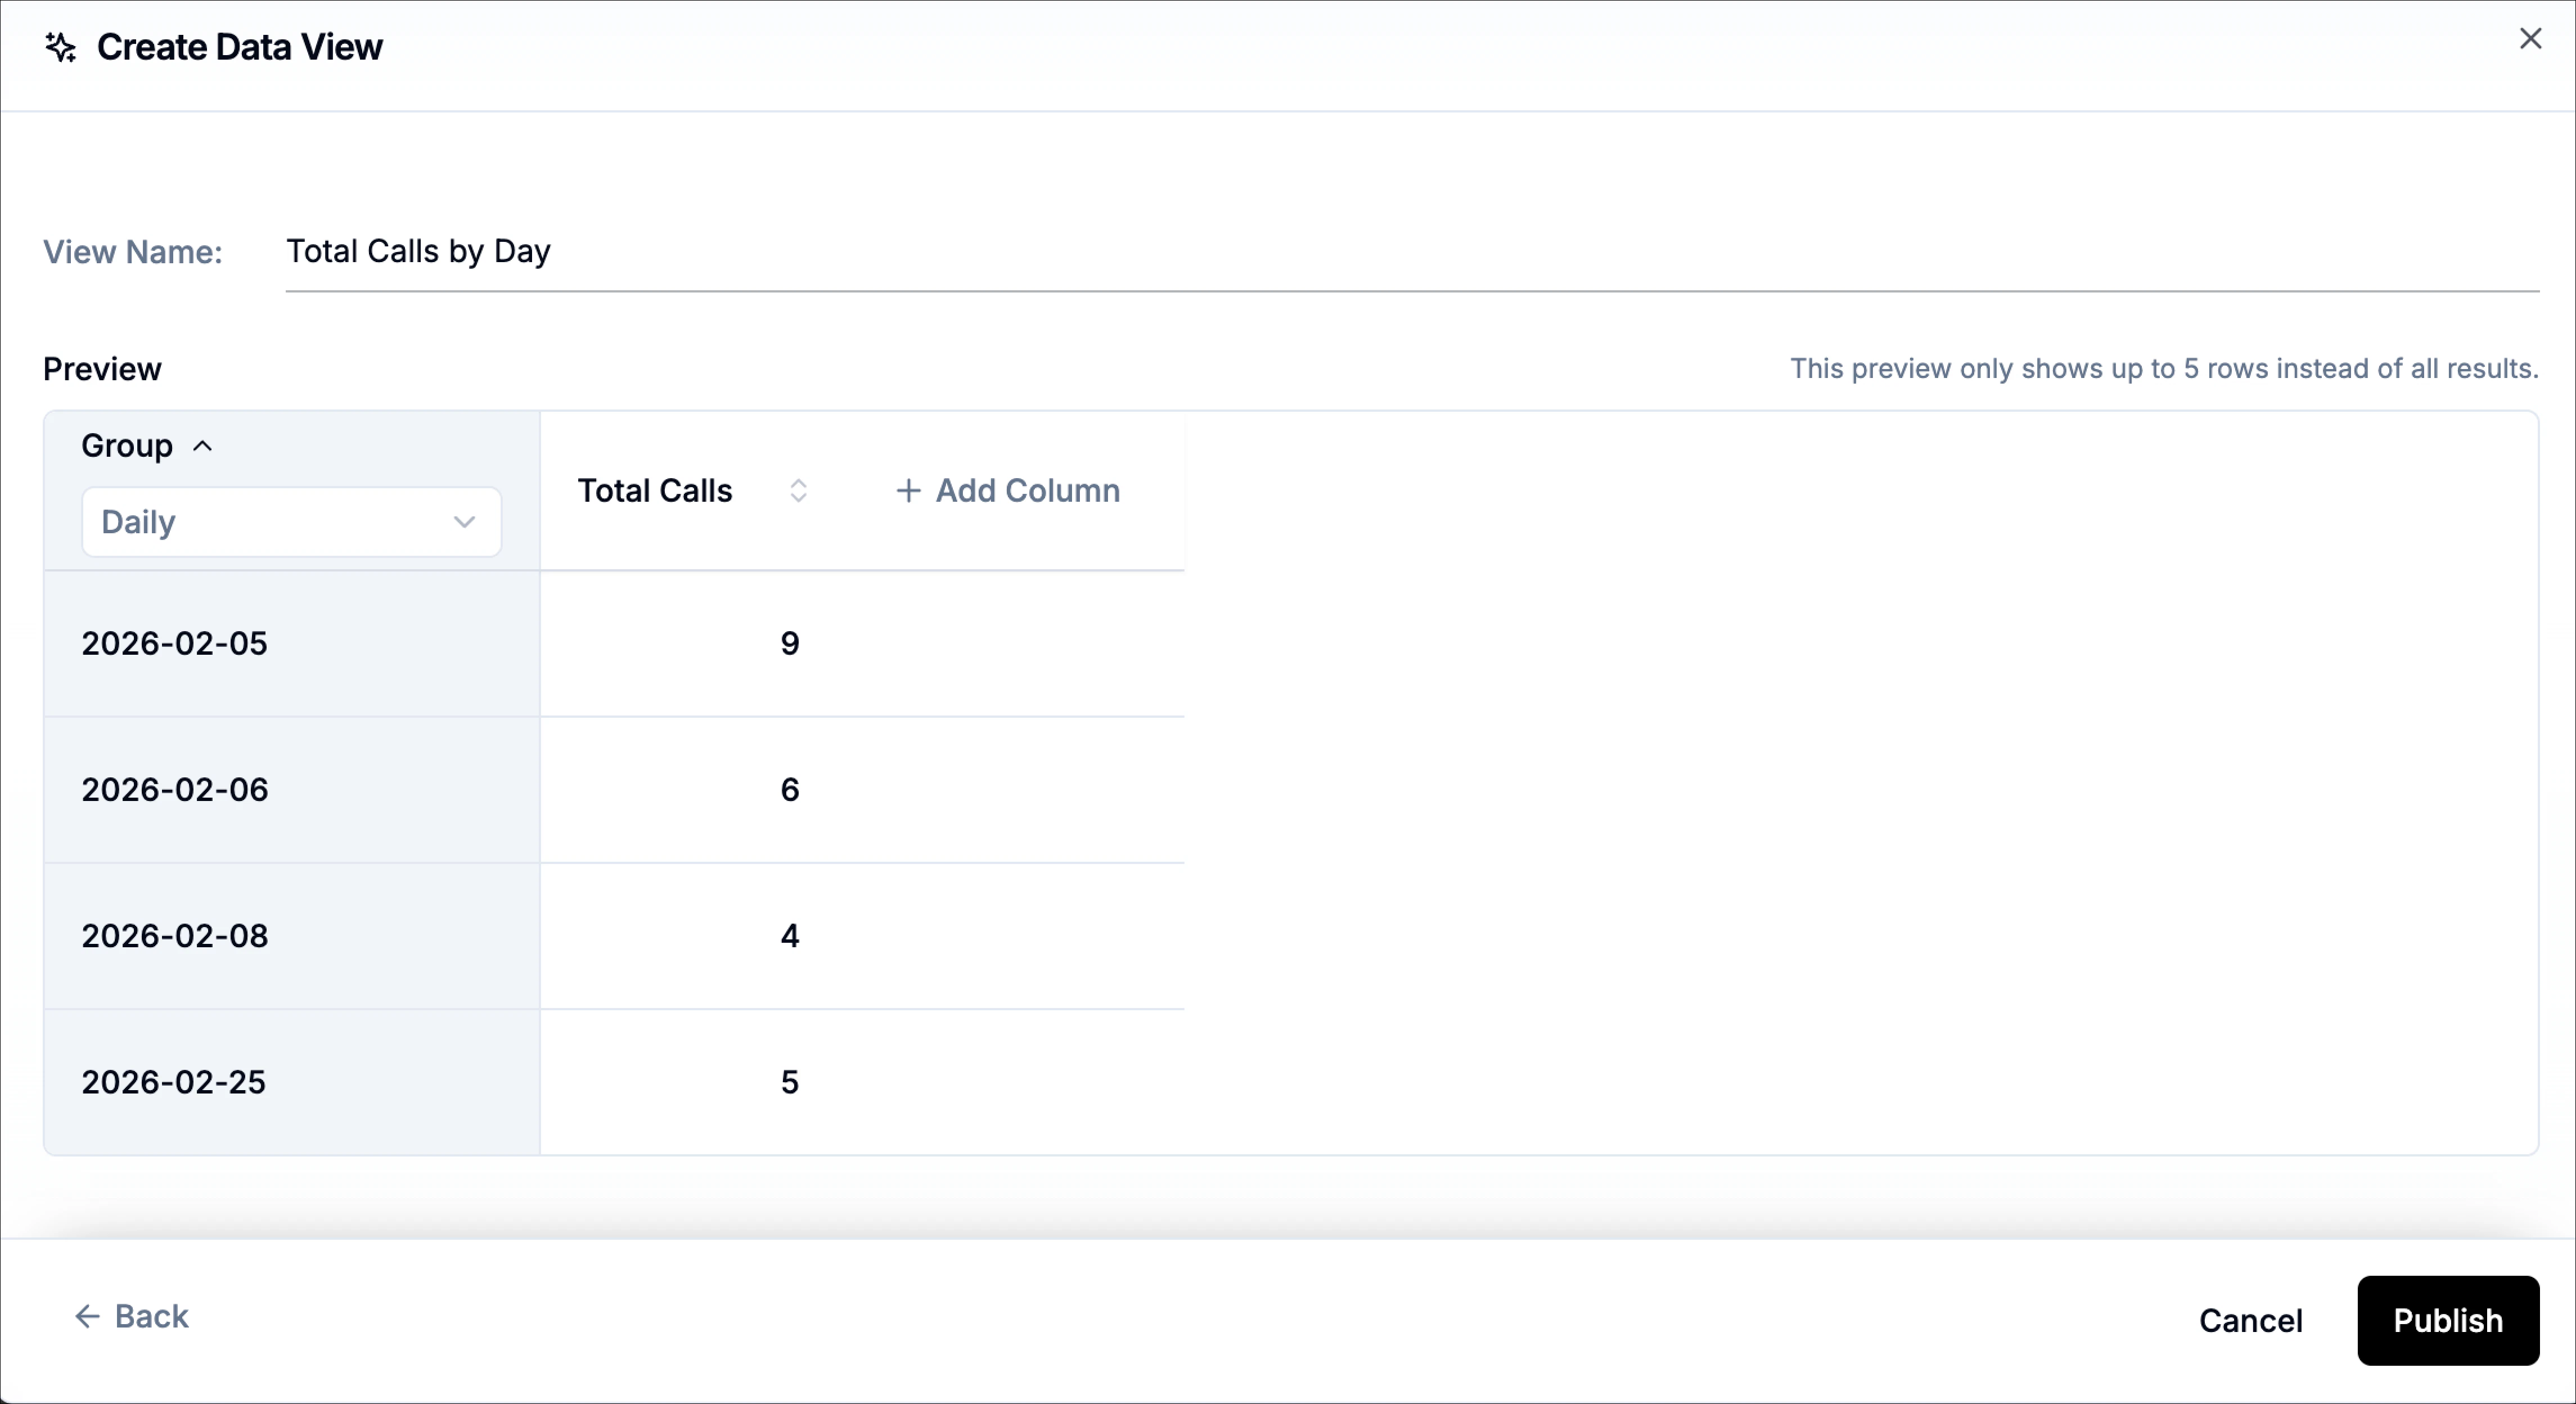
This starts you with a default configuration (Daily grouping, one "Total Calls" column). From there:
1. Enter a **View Name** that describes the table's purpose
2. Choose a **Grouping** from the dropdown
3. Click **+ Add Column** to define metric formulas
4. Check the **Preview** to verify the structure
5. Click **Publish** to save
Time granularity options are filtered automatically based on your selected date range. For example, "Monthly" will not appear if the date range is only a few days.
## Creating a View
Click **+ Add view** to open the creation dialog. You have two paths:
Type a natural language description of what you want to see. For example:
> Show daily total calls, success rate, and negative sentiment rate
Phonely generates a complete view configuration -- name, grouping, and metric columns -- from your description. A live preview appears so you can review and refine before publishing.
You can also pick from AI-generated suggestion chips like:
* "Show total calls by day"
* "Track appointment booked rate by week"
* "Show avg duration by customer phone number"
* "Compare outcomes by day"
After the preview loads, you can send **follow-up prompts** to iteratively add or replace metrics without starting over.
Click **Build Manually** at the bottom of the dialog.
This starts you with a default configuration (Daily grouping, one "Total Calls" column). From there:
1. Enter a **View Name** that describes the table's purpose
2. Choose a **Grouping** from the dropdown
3. Click **+ Add Column** to define metric formulas
4. Check the **Preview** to verify the structure
5. Click **Publish** to save
 ## Metric Columns
Each column in the table (after the grouping column) is a **metric** defined by a name, a formula, and an optional target.
### Naming Metrics
The metric name is the column header. Make it descriptive enough that someone can understand the value without reading the formula.
If a formula returns a percentage, include **Rate** or **%** in the name. If it returns minutes, mention **min**. Example: "Negative Sentiment Rate (%)" or "Avg Duration (min)".
### Formula Language
Formulas define how each metric is calculated per row group. They support arithmetic expressions with variable references.
**Operators:** `+` `-` `*` `/` `%` (modulo) `(` `)` parentheses
**Max formula length:** 500 characters.
When you click into the formula field, an autocomplete menu appears (triggered by `@`) showing all available variables organized by category.
## Metric Columns
Each column in the table (after the grouping column) is a **metric** defined by a name, a formula, and an optional target.
### Naming Metrics
The metric name is the column header. Make it descriptive enough that someone can understand the value without reading the formula.
If a formula returns a percentage, include **Rate** or **%** in the name. If it returns minutes, mention **min**. Example: "Negative Sentiment Rate (%)" or "Avg Duration (min)".
### Formula Language
Formulas define how each metric is calculated per row group. They support arithmetic expressions with variable references.
**Operators:** `+` `-` `*` `/` `%` (modulo) `(` `)` parentheses
**Max formula length:** 500 characters.
When you click into the formula field, an autocomplete menu appears (triggered by `@`) showing all available variables organized by category.
 ### Core Variables
Always available, regardless of agent configuration.
| Variable | Returns | Description |
| :--------------------------- | :---------------- | :-------------------------------- |
| `@total` | Count | Total calls in the row group |
| `@duration` | Average (seconds) | Average call duration |
| `@custom_call_outcome_value` | Average | Average custom call outcome value |
| `@total_transfer_duration` | Average (seconds) | Average total transfer duration |
### Namespaced Variables
Namespaced variables count calls matching a specific metadata category within the row group. They return **counts**, making them ideal for percentages and ratios.
Count calls that include a specific outcome from the agent's **latest published version**. Only outcomes present in the published flows appear in the autocomplete.
**Example formulas:**
```text theme={null}
(@outcome.Appointment_Confirmed / @total) * 100
```
```text theme={null}
@outcome.Call_Escalated + @outcome.Assistance_Requested
```
Count calls matching a custom call outcome value. These are populated from observed values in your call data.
**Example formula:**
```text theme={null}
(@custom_call_outcome.sale_completed / @total) * 100
```
Count calls tagged with a specific call topic **currently configured for the agent**. Only active topics appear in the autocomplete.
**Example formulas:**
```text theme={null}
(@topic.appointment_booked / @total) * 100
```
```text theme={null}
@topic.callback_requested
```
Count calls by sentiment classification. Three fixed values:
| Variable | Description |
| :-------------------- | :----------------------- |
| `@sentiment.positive` | Positive sentiment count |
| `@sentiment.neutral` | Neutral sentiment count |
| `@sentiment.negative` | Negative sentiment count |
**Example formula:**
```text theme={null}
(@sentiment.negative / @total) * 100
```
Count calls by how they ended.
| Variable | Meaning |
| :------------------------------------------ | :---------------------------------- |
| `@ended_reason.assistant-ended-call` | Assistant ended the call |
| `@ended_reason.assistant-forwarded-call` | Assistant forwarded the call |
| `@ended_reason.customer-ended-call` | Customer hung up |
| `@ended_reason.hangup-during-warm-transfer` | Caller hung up during warm transfer |
| `@ended_reason.max-duration-reached` | Hit maximum call duration |
| `@ended_reason.silence-timeout` | Silence timeout triggered |
| `@ended_reason.voicemail` | Call reached voicemail |
**Example formula:**
```text theme={null}
(@ended_reason.voicemail / @total) * 100
```
Count calls that passed through a specific workflow block. These are populated from the published inbound workflow's action nodes.
**Example formula:**
```text theme={null}
(@block.transfer_call_123__wf_abc123 / @total) * 100
```
### Exclusion Directives
Exclusions remove calls from the calculation **before** the metric is computed. Append them to the end of a formula.
| Syntax | Effect |
| :----------------- | :------------------------------------------------ |
| `-@{metadata_key}` | Exclude calls with a specific custom metadata key |
| `-@outcome.value` | Exclude calls with a specific outcome |
| `-@topic.value` | Exclude calls with a specific topic |
**Example:** Calculate success rate excluding calls that have a `lead_id` metadata key:
```text theme={null}
(@outcome.success / @total) * 100 -@{lead_id}
```
Exclusion shorthand: `-@sentiment.negative` (no space, unary minus attached to a sentiment or end-reason variable) expands to `(@total - @sentiment.negative)`. This is a subtraction, not an exclusion directive.
### Example Formulas
| Goal | Formula |
| :-------------------------- | :---------------------------------------------------- |
| Total calls | `@total` |
| Appointment booked rate (%) | `(@outcome.Appointment_Confirmed / @total) * 100` |
| Negative sentiment rate (%) | `(@sentiment.negative / @total) * 100` |
| Average duration in minutes | `@duration / 60` |
| Voicemail rate (%) | `(@ended_reason.voicemail / @total) * 100` |
| Customer hangup rate (%) | `(@ended_reason.customer-ended-call / @total) * 100` |
| Combined escalation count | `@outcome.Call_Escalated + @topic.callback_requested` |
Division by zero returns `0`. Missing variables default to `0`. Formulas are validated both client-side and server-side before saving.
## Targets
Targets let you compare a metric against a KPI threshold. When enabled, cells are highlighted **green** when they meet the target and **red** when they miss it.
Each target has two parts:
The metric is on-target when the value is **at or above** the threshold.
Use for: success rate, appointment rate, total calls.
The metric is on-target when the value is **at or below** the threshold.
Use for: negative sentiment rate, voicemail rate, avg duration.
### Core Variables
Always available, regardless of agent configuration.
| Variable | Returns | Description |
| :--------------------------- | :---------------- | :-------------------------------- |
| `@total` | Count | Total calls in the row group |
| `@duration` | Average (seconds) | Average call duration |
| `@custom_call_outcome_value` | Average | Average custom call outcome value |
| `@total_transfer_duration` | Average (seconds) | Average total transfer duration |
### Namespaced Variables
Namespaced variables count calls matching a specific metadata category within the row group. They return **counts**, making them ideal for percentages and ratios.
Count calls that include a specific outcome from the agent's **latest published version**. Only outcomes present in the published flows appear in the autocomplete.
**Example formulas:**
```text theme={null}
(@outcome.Appointment_Confirmed / @total) * 100
```
```text theme={null}
@outcome.Call_Escalated + @outcome.Assistance_Requested
```
Count calls matching a custom call outcome value. These are populated from observed values in your call data.
**Example formula:**
```text theme={null}
(@custom_call_outcome.sale_completed / @total) * 100
```
Count calls tagged with a specific call topic **currently configured for the agent**. Only active topics appear in the autocomplete.
**Example formulas:**
```text theme={null}
(@topic.appointment_booked / @total) * 100
```
```text theme={null}
@topic.callback_requested
```
Count calls by sentiment classification. Three fixed values:
| Variable | Description |
| :-------------------- | :----------------------- |
| `@sentiment.positive` | Positive sentiment count |
| `@sentiment.neutral` | Neutral sentiment count |
| `@sentiment.negative` | Negative sentiment count |
**Example formula:**
```text theme={null}
(@sentiment.negative / @total) * 100
```
Count calls by how they ended.
| Variable | Meaning |
| :------------------------------------------ | :---------------------------------- |
| `@ended_reason.assistant-ended-call` | Assistant ended the call |
| `@ended_reason.assistant-forwarded-call` | Assistant forwarded the call |
| `@ended_reason.customer-ended-call` | Customer hung up |
| `@ended_reason.hangup-during-warm-transfer` | Caller hung up during warm transfer |
| `@ended_reason.max-duration-reached` | Hit maximum call duration |
| `@ended_reason.silence-timeout` | Silence timeout triggered |
| `@ended_reason.voicemail` | Call reached voicemail |
**Example formula:**
```text theme={null}
(@ended_reason.voicemail / @total) * 100
```
Count calls that passed through a specific workflow block. These are populated from the published inbound workflow's action nodes.
**Example formula:**
```text theme={null}
(@block.transfer_call_123__wf_abc123 / @total) * 100
```
### Exclusion Directives
Exclusions remove calls from the calculation **before** the metric is computed. Append them to the end of a formula.
| Syntax | Effect |
| :----------------- | :------------------------------------------------ |
| `-@{metadata_key}` | Exclude calls with a specific custom metadata key |
| `-@outcome.value` | Exclude calls with a specific outcome |
| `-@topic.value` | Exclude calls with a specific topic |
**Example:** Calculate success rate excluding calls that have a `lead_id` metadata key:
```text theme={null}
(@outcome.success / @total) * 100 -@{lead_id}
```
Exclusion shorthand: `-@sentiment.negative` (no space, unary minus attached to a sentiment or end-reason variable) expands to `(@total - @sentiment.negative)`. This is a subtraction, not an exclusion directive.
### Example Formulas
| Goal | Formula |
| :-------------------------- | :---------------------------------------------------- |
| Total calls | `@total` |
| Appointment booked rate (%) | `(@outcome.Appointment_Confirmed / @total) * 100` |
| Negative sentiment rate (%) | `(@sentiment.negative / @total) * 100` |
| Average duration in minutes | `@duration / 60` |
| Voicemail rate (%) | `(@ended_reason.voicemail / @total) * 100` |
| Customer hangup rate (%) | `(@ended_reason.customer-ended-call / @total) * 100` |
| Combined escalation count | `@outcome.Call_Escalated + @topic.callback_requested` |
Division by zero returns `0`. Missing variables default to `0`. Formulas are validated both client-side and server-side before saving.
## Targets
Targets let you compare a metric against a KPI threshold. When enabled, cells are highlighted **green** when they meet the target and **red** when they miss it.
Each target has two parts:
The metric is on-target when the value is **at or above** the threshold.
Use for: success rate, appointment rate, total calls.
The metric is on-target when the value is **at or below** the threshold.
Use for: negative sentiment rate, voicemail rate, avg duration.
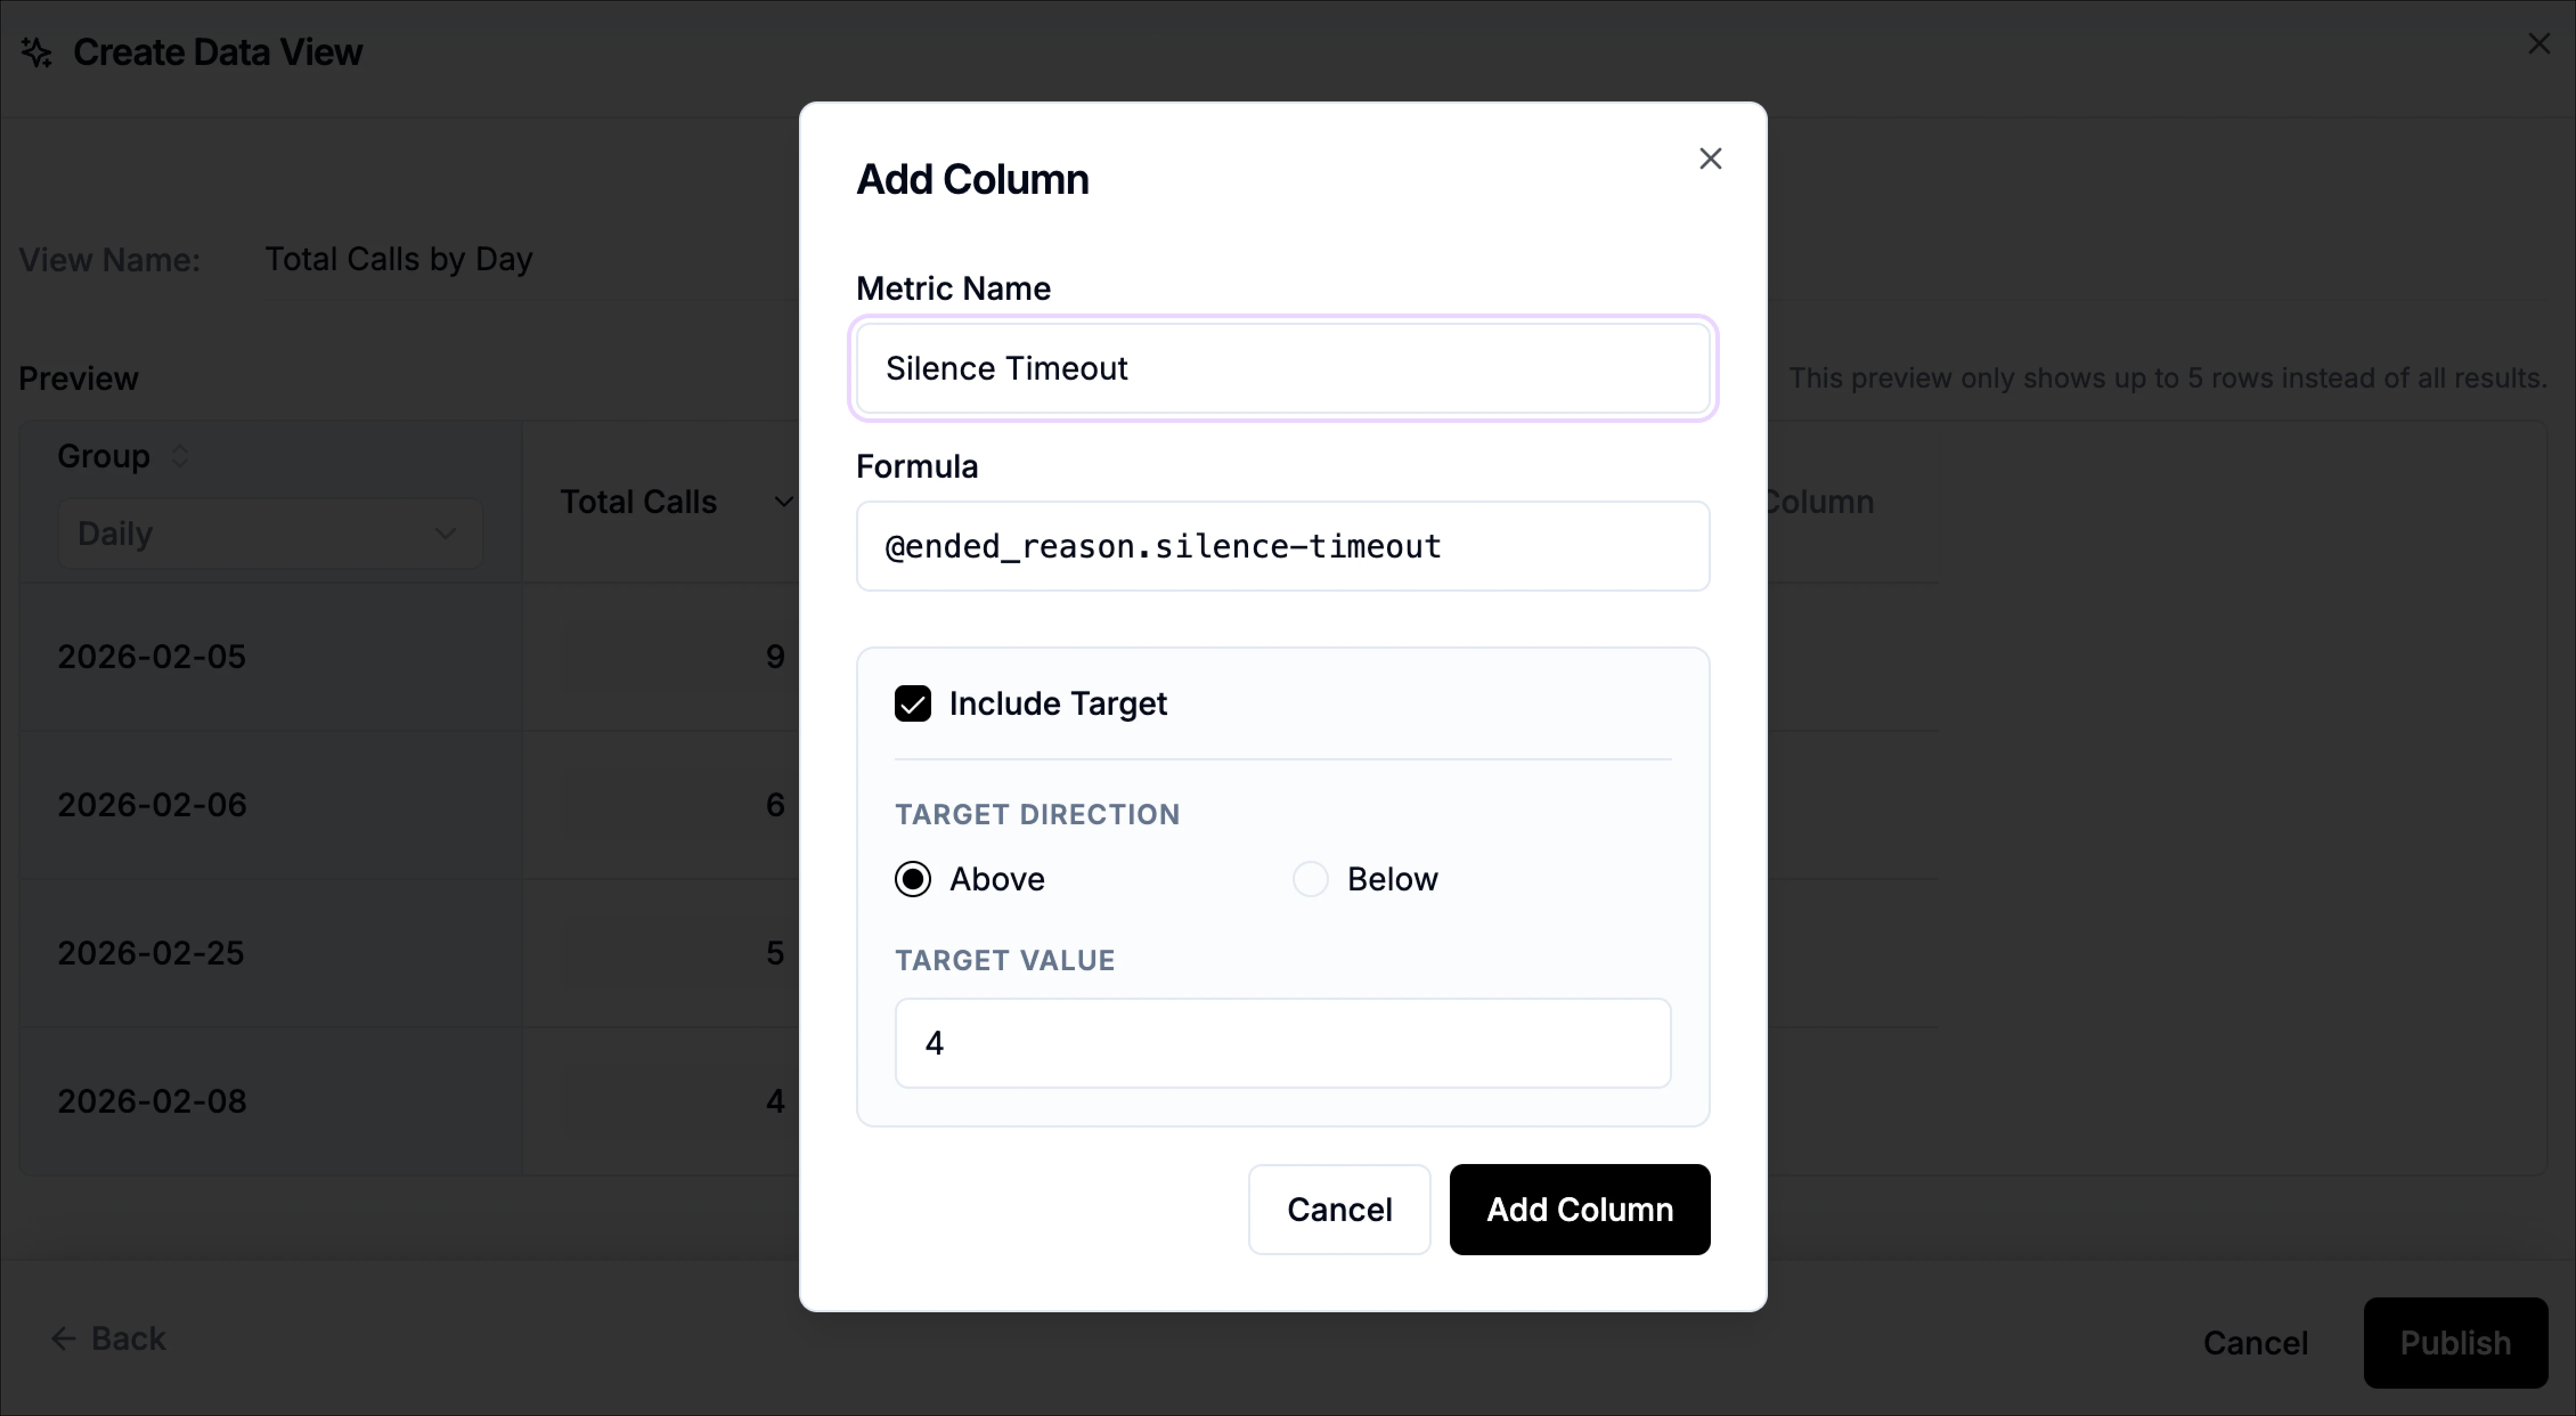 The target value should match the unit and scale of your formula. If the formula returns a percentage, set the target as a percentage (e.g., `75`). If it returns minutes, set the target in minutes (e.g., `4`).
Not every metric needs a target. Targets work best for metrics tied to a real business benchmark where you want to quickly scan for rows that are off-track.
## Sorting
Click the sort icon on any column header to toggle between descending and ascending order. The sort preference is saved as part of the view configuration.
For time-based groupings, the default sort is by date (newest first). For other groupings, the default sort is by the first metric (highest first).
## Drill-Down
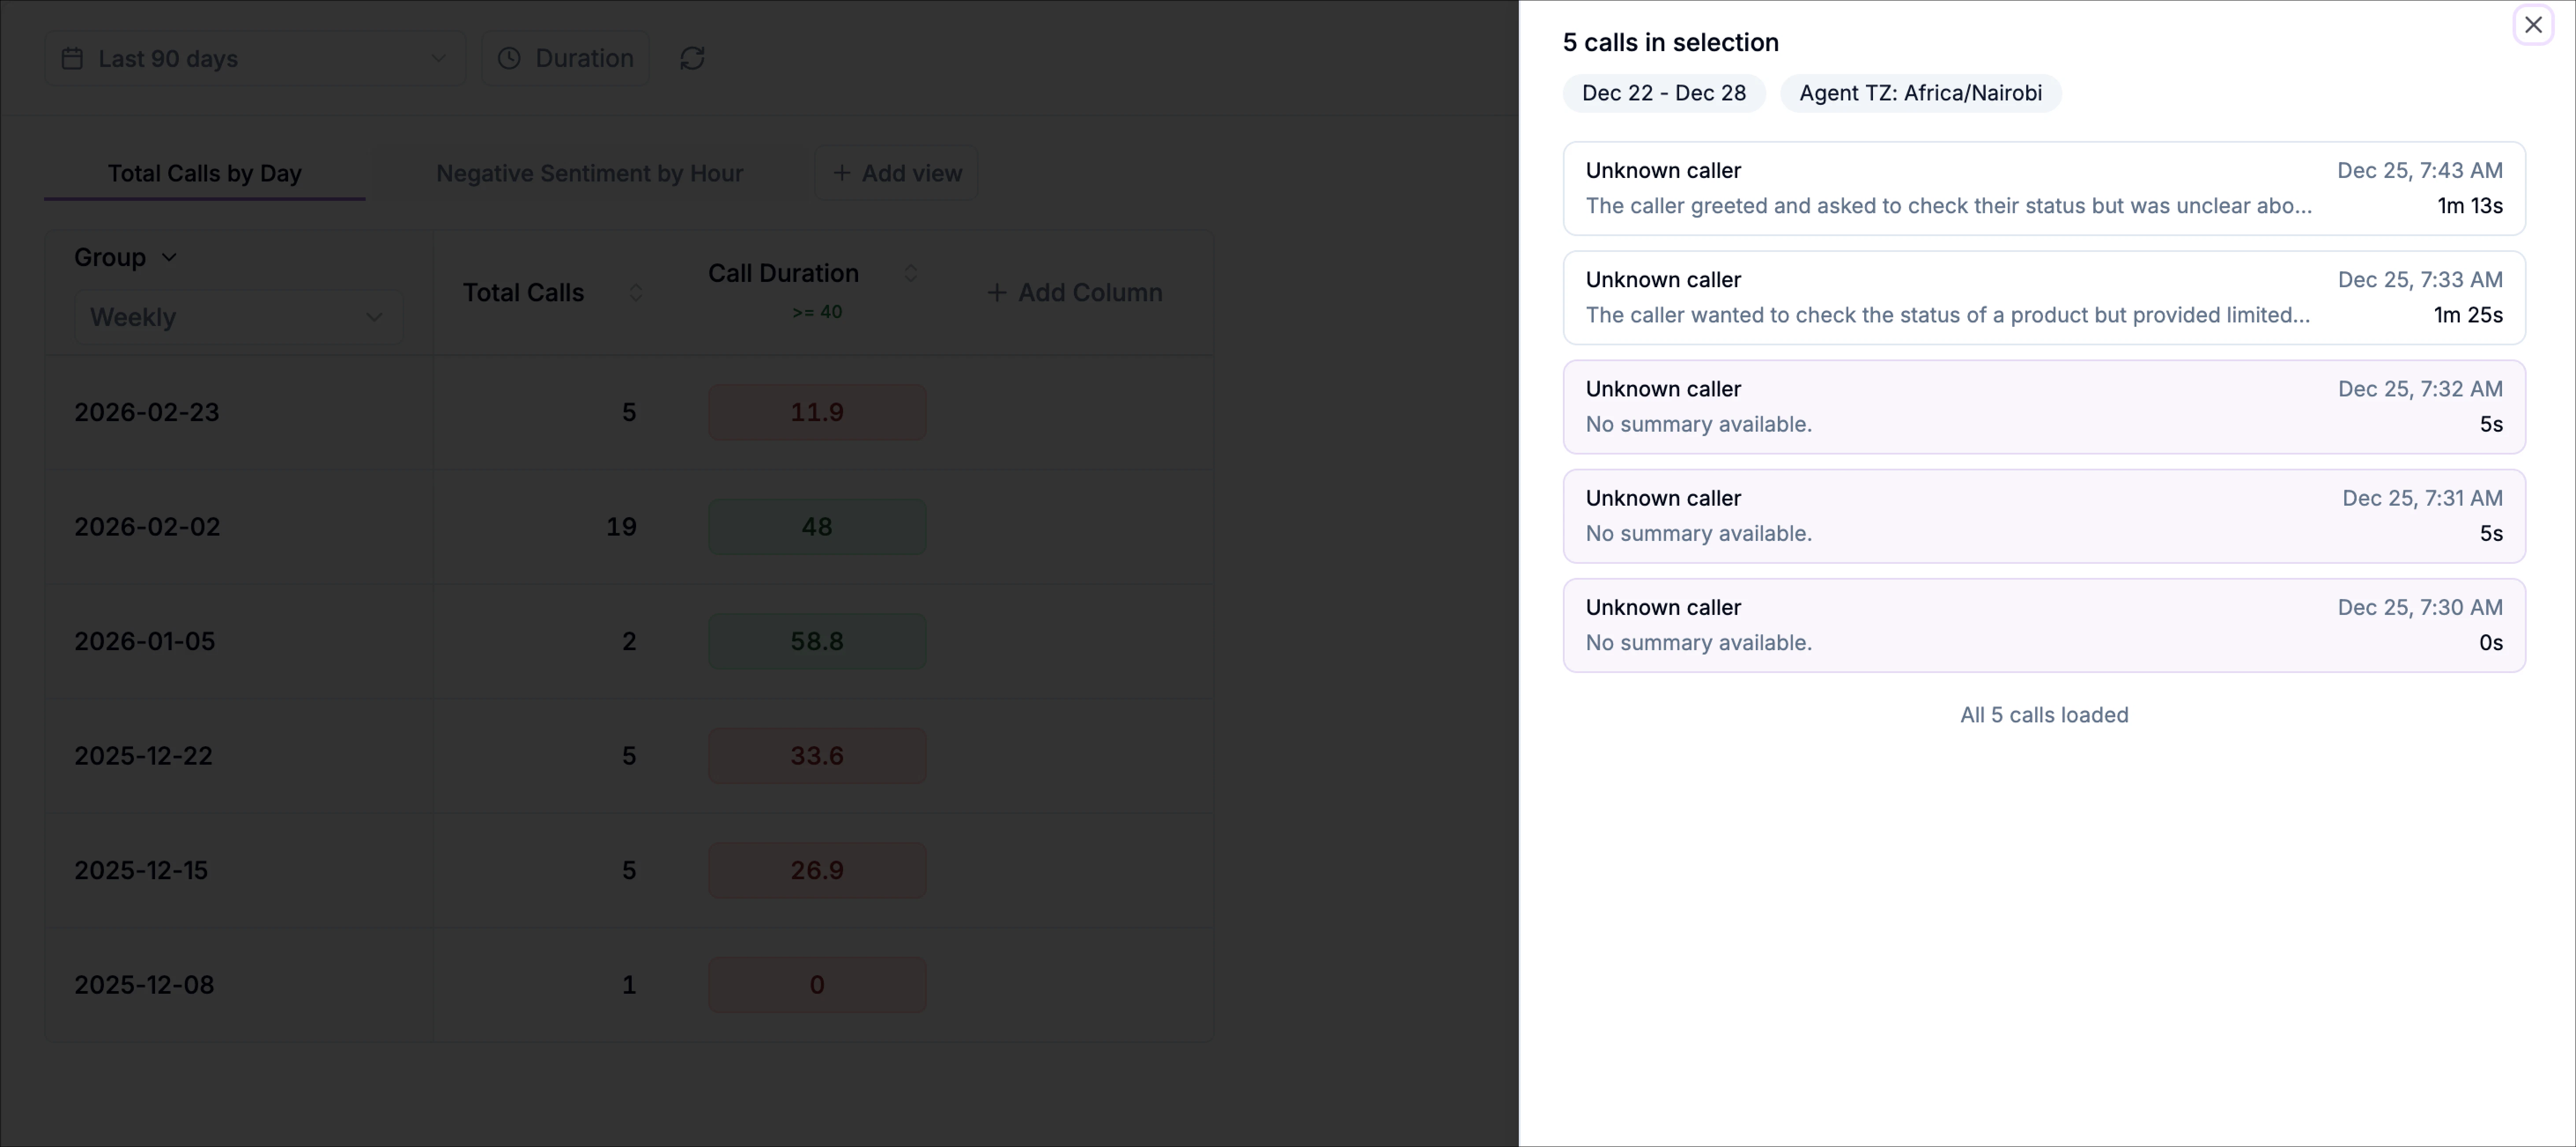
Click any **metric cell** to open a slide-over panel showing the individual calls that produced that value.
The drill-down extracts variables from the metric formula and uses them as filters:
* **Simple formulas** (no division): shows all calls matching any referenced variable
* **Ratio formulas** (with `/`): shows only the **numerator-side calls** -- the ones that drove the percentage
For example, `(@sentiment.negative / @total) * 100` drills into the negative-sentiment calls only, not every call in the denominator.
The date range is scoped to the row's time bucket, and group-based filters (prompt version, phone number) are applied automatically.
* Review call summaries, timestamps, and durations
* Click any call to open the full **Call Details** modal
* Validate that a metric is counting the right calls
* Investigate spikes or drops in a rate
* Compare across groups by clicking different cells
The target value should match the unit and scale of your formula. If the formula returns a percentage, set the target as a percentage (e.g., `75`). If it returns minutes, set the target in minutes (e.g., `4`).
Not every metric needs a target. Targets work best for metrics tied to a real business benchmark where you want to quickly scan for rows that are off-track.
## Sorting
Click the sort icon on any column header to toggle between descending and ascending order. The sort preference is saved as part of the view configuration.
For time-based groupings, the default sort is by date (newest first). For other groupings, the default sort is by the first metric (highest first).
## Drill-Down
Click any **metric cell** to open a slide-over panel showing the individual calls that produced that value.
The drill-down extracts variables from the metric formula and uses them as filters:
* **Simple formulas** (no division): shows all calls matching any referenced variable
* **Ratio formulas** (with `/`): shows only the **numerator-side calls** -- the ones that drove the percentage
For example, `(@sentiment.negative / @total) * 100` drills into the negative-sentiment calls only, not every call in the denominator.
The date range is scoped to the row's time bucket, and group-based filters (prompt version, phone number) are applied automatically.
* Review call summaries, timestamps, and durations
* Click any call to open the full **Call Details** modal
* Validate that a metric is counting the right calls
* Investigate spikes or drops in a rate
* Compare across groups by clicking different cells
 ## Managing Views
### Editing a View
Click the dropdown menu on any view tab to access **Edit**. You can update the view name and description. To modify grouping, columns, or formulas, use the inline controls directly in the table.
### Deleting a View
Click the dropdown menu on a view tab and select **Delete**. You cannot delete the last remaining view.
### Exporting to CSV
Click **Export CSV** in the view tabs bar. Phonely fetches all rows (not just the visible page) and downloads a CSV file named with the view name and a timestamp.
## Building Effective Views
Begin with one grouping and one metric (e.g., Daily + Total Calls). Confirm the preview looks right before adding complexity.
Add one column at a time. Check the preview after each addition to catch formula errors early.
Only add targets for metrics tied to a real business goal. Too many targets create visual noise.
After publishing, click a few cells to confirm the underlying calls match your expectations.
Use names like "Daily Success Rate" or "Weekly Sentiment by Prompt" so teammates can find the right view without opening each one.
## Managing Views
### Editing a View
Click the dropdown menu on any view tab to access **Edit**. You can update the view name and description. To modify grouping, columns, or formulas, use the inline controls directly in the table.
### Deleting a View
Click the dropdown menu on a view tab and select **Delete**. You cannot delete the last remaining view.
### Exporting to CSV
Click **Export CSV** in the view tabs bar. Phonely fetches all rows (not just the visible page) and downloads a CSV file named with the view name and a timestamp.
## Building Effective Views
Begin with one grouping and one metric (e.g., Daily + Total Calls). Confirm the preview looks right before adding complexity.
Add one column at a time. Check the preview after each addition to catch formula errors early.
Only add targets for metrics tied to a real business goal. Too many targets create visual noise.
After publishing, click a few cells to confirm the underlying calls match your expectations.
Use names like "Daily Success Rate" or "Weekly Sentiment by Prompt" so teammates can find the right view without opening each one.