> ## Documentation Index
> Fetch the complete documentation index at: https://docs.phonely.ai/llms.txt
> Use this file to discover all available pages before exploring further.
# Call History and Analytics
> Learn to leverage Phonely's call history and analytics features for optimized call management and insights.
Phonely’s Call History and Analytics dashboard provide a centralized view of every conversation that occurs in Phonely. Each call is automatically logged with detailed metadata - including call duration, sentiment, outcomes, and transcripts - helping you understand not just what happened, but why.
These insights help teams monitor performance, debug workflows, and optimize customer interactions at scale.
Leverage Phonely’s call history tools to gain visibility, analyze, and optimize call outcomes, improving both operational efficiency and customer satisfaction.
1. From the left navigation panel, click **Call History** under the call section.
2. You’ll see a table view listing all calls made or received by your Phonely agents.
A colored indicator next to each call reflects its read status, helping you quickly distinguish new calls from those you’ve already reviewed.
## Key Features
| Feature | Description |
| :------------------------------------- | :------------------------------------------------------------------------------------------------------------------------------------------------------------------------------------------------------------------ |
| **Comprehensive Call Logging** | Every inbound, outbound, and web call is automatically logged with duration, call type, detected topic, outcome, sentiment, and end reason for full visibility into each interaction. |
| **Modernized Call History Experience** | The Call History page has been redesigned for speed and clarity, featuring infinite scroll (no pagination), auto-refresh every 10 seconds, and smoother day-to-day navigation. |
| **Advanced Filtering & Views** | Quickly narrow results using a redesigned filter module with support for date range, duration, call type, outcome, sentiment, status, and end reason, plus dedicated views for in-progress calls and calls on hold. |
| **Read & Unread Call Tracking** | Easily distinguish new calls from reviewed ones with clear read/unread indicators, bulk selection, and “select all” actions for faster triage. |
| **Context at a Glance** | Instantly see sentiment indicators and a short AI-generated recap of why the caller reached out, helping you prioritize which calls to open first. |
| **Playback Controls** | Replay any call, adjust playback speed, or download audio recordings for QA or training. |
| **Powerful Global Search** | Search across call outcomes, transcripts, and phone numbers to quickly locate specific conversations or patterns. |
| **Detailed Call Insights** | Open any call to review summaries, full transcripts, and how the conversation progressed through individual workflow blocks. |
| **Outcome & End Reason Tracking** | Understand exactly how calls ended whether customer-ended, AI-ended, transferred, timed out, or placed on hold. |
| **Call Path Analysis** | Identify which workflows, outcomes, and paths are most common across your calls to guide optimization and flow improvements. |
| **Analyze with AI** | Select any group of calls and use AI to understand what's happening -- why callers are reaching out, where conversations go well, and where they need improvement. |
# Analyze with AI
When you're reviewing calls, you can select any group of conversations and ask AI to help you understand what's going on. Instead of listening to each call one by one, you can get answers about trends, issues, and opportunities across all of them at once.
### How to Use It
1. Open **Call History** from the left navigation.
2. Select one or more calls using the checkboxes.
3. Click **Analyze with AI** in the action bar.
4. Ask a question about the selected calls.
You can click on any call in the conversation to jump directly to its full detail view.
### What You Can Ask
* "Why are callers hanging up during the greeting?"
* "Which of these calls resulted in a booked appointment?"
* "What are the most common questions callers are asking this week?"
* "Are there any calls where the agent gave incorrect information?"
* "How are these calls being handled differently from each other?"
## Filtering & Sorting Calls
To open the filters panel, click the filter icon in the top-right corner of the call history page. The panel slides in, allowing you to refine the call list in real time.
Use the filters panel to narrow your call list and focus on specific scenarios.
### Available Filters
| Filter Category | Options |
| :----------------- | :------------------------------------------------------------------------------------------------------------------------------------------------------------------------ |
| **Date Range** | Today, Yesterday, Last 7 days, Last 14 days, Last 30 days, Last 90 days, Custom range (calendar picker) |
| **Duration** | Presets: \< 1 min, 1–5 min, > 5 min Adjustable duration slider (0:00 → 60:00+) |
| **Status** | Completed, Failed, Ended, Queued, In Progress, In Warm Transfer |
| **Call Outcome** | Greeting Hangup Identify Purpose Collect Info Appointment Booking Legal Matter Custom workflow outcomes (e.g., *Solar Appointment Confirmation*) |
| **Call Type** | Inbound Outbound Web Call |
| **Ended Reason** | Customer Ended Phonely Ended Silence Timeout Call Transfer Hangup During Warm Transfer Voicemail Max Duration |
| **Sentiment** | Positive Neutral Negative |
| **Calls Per Page** | 100, 250, 500, 1,000, 2,500, 5,000 |
Once you’ve selected your filters, click **Apply** to immediately update the call list.
## Reviewing Call Details
Click any call in the call history table to open the call detail view. This page provides a detailed breakdown of how the conversation unfolded, what actions were taken during the call, and how the workflow executed.
The call detail view is organized into two primary areas:
* **Conversation panel** – shows the interaction between the caller and the Phonely agent.
* **Insights panel** – displays call summaries, metadata, and workflow execution details.
At the top of the insights panel you will find two tabs the **highlights** and **blocks** tabs.
These tabs allow you to analyze the call from both a conversation overview perspective and a workflow execution perspective.
## Conversation Panel
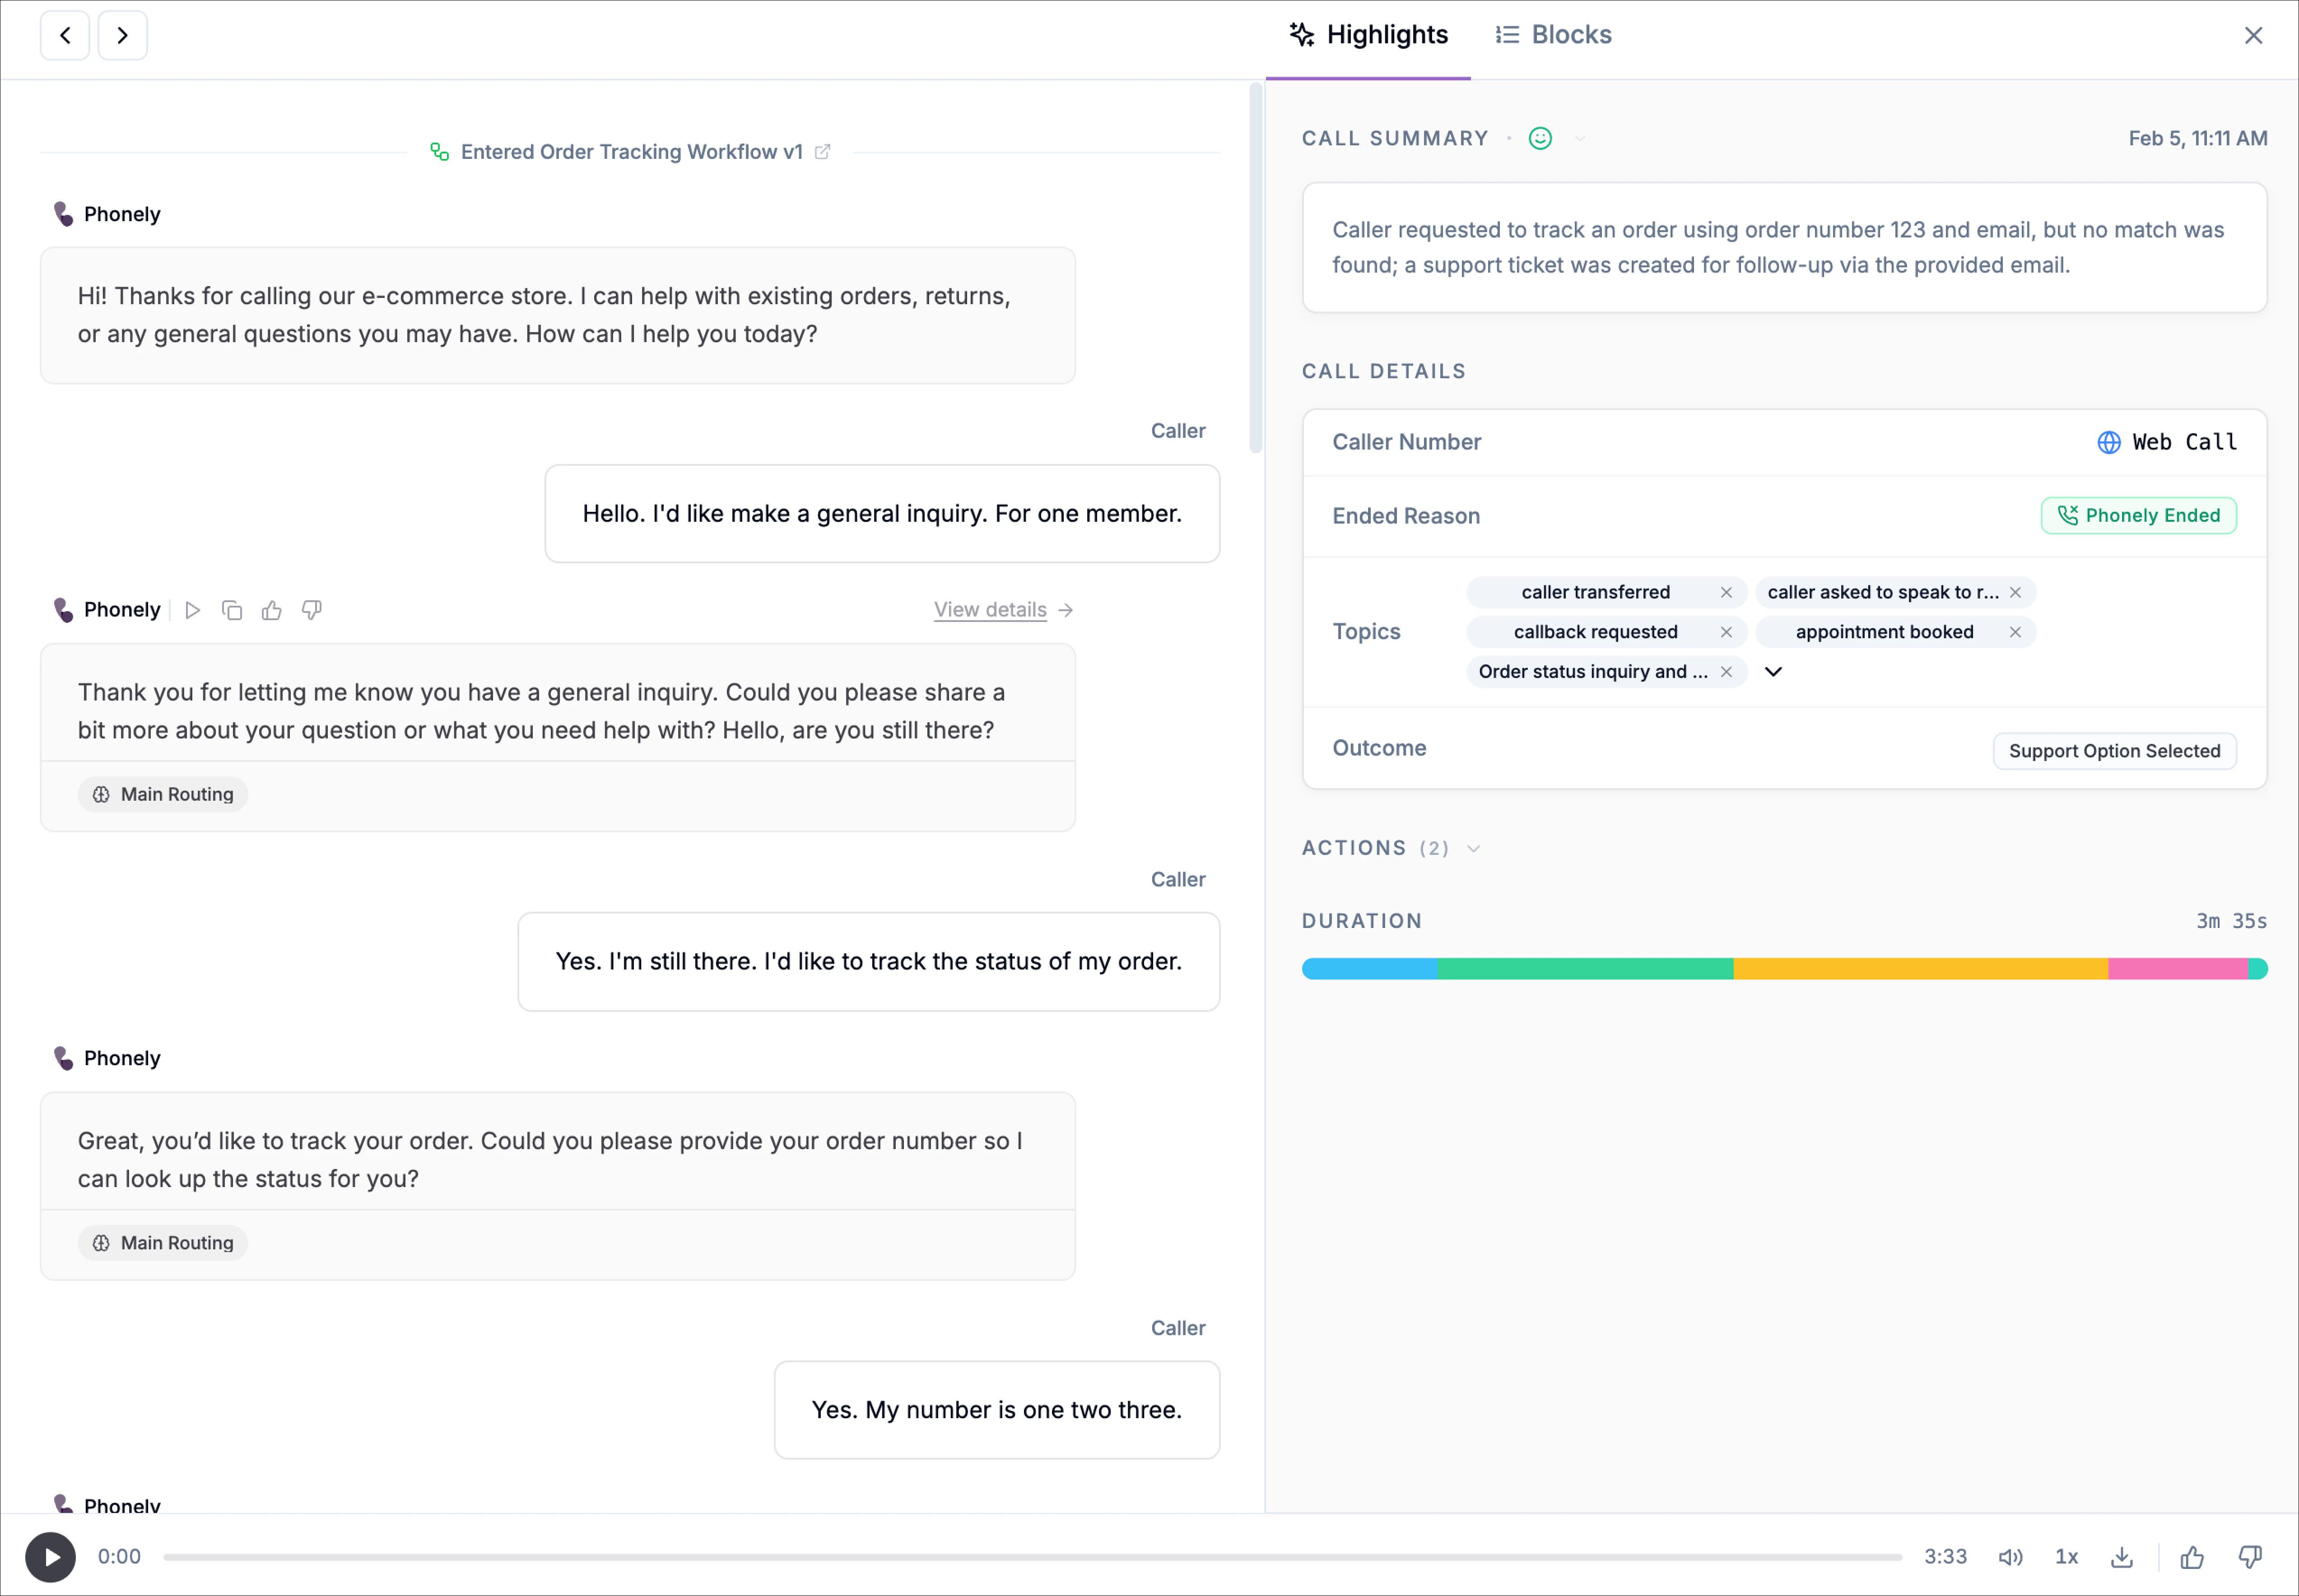
The conversation panel appears on the left side of the Call Detail view. It displays the full interaction between the caller and the Phonely agent in a chronological, chat-style format. This view allows you to review exactly what was said during the call while also seeing where the conversation moved through different workflow blocks.
The main body of each Phonely message shows the exact response that was delivered during the call. This allows you to inspect the wording used by the agent and compare it with the caller’s response. Each message is shown as a conversation bubble, making it easy to distinguish between the two participants:
* **Phonely** – responses generated by the AI agent.
* **Caller** – responses spoken by the caller.
Messages appear in the order they occurred during the call, allowing you to follow the flow of the conversation from start to finish.
Below a Phonely message, additional metadata chips appear. These chips provide more context about the workflow step. They include:
* **Block tag** – shows the workflow block that generated the response, such as main routing or end call
* **Variable count** – shows how many variables were stored or used in that step, such as **3 variables**
These labels help connect the conversation directly to the workflow logic that produced the response.
Each workflow block shown in the conversation can be clicked. Selecting a block opens the corresponding block in the blocks tab on the right side of the interface.
From the **Blocks tab**, you can view additional execution details for that block, including:
* The block configuration
* Execution status
* Conditions evaluated
* Variables captured
* API requests or integrations triggered
* The exact messages generated during that step
This interaction allows you to quickly move from the conversation view to the underlying workflow logic, making it easier to inspect how a response was generated and troubleshoot workflow behaviour.
Agent messages may include additional controls that allow you to interact with the response. These controls can include:
* **Play** – play the audio for that specific response
* **Copy** – copy the message text
* **Feedback controls** – provide feedback on the quality of the response
You can use the **thumbs up** or **thumbs down** icons shown above a Phonely message to indicate whether the response was correct or needs improvement.
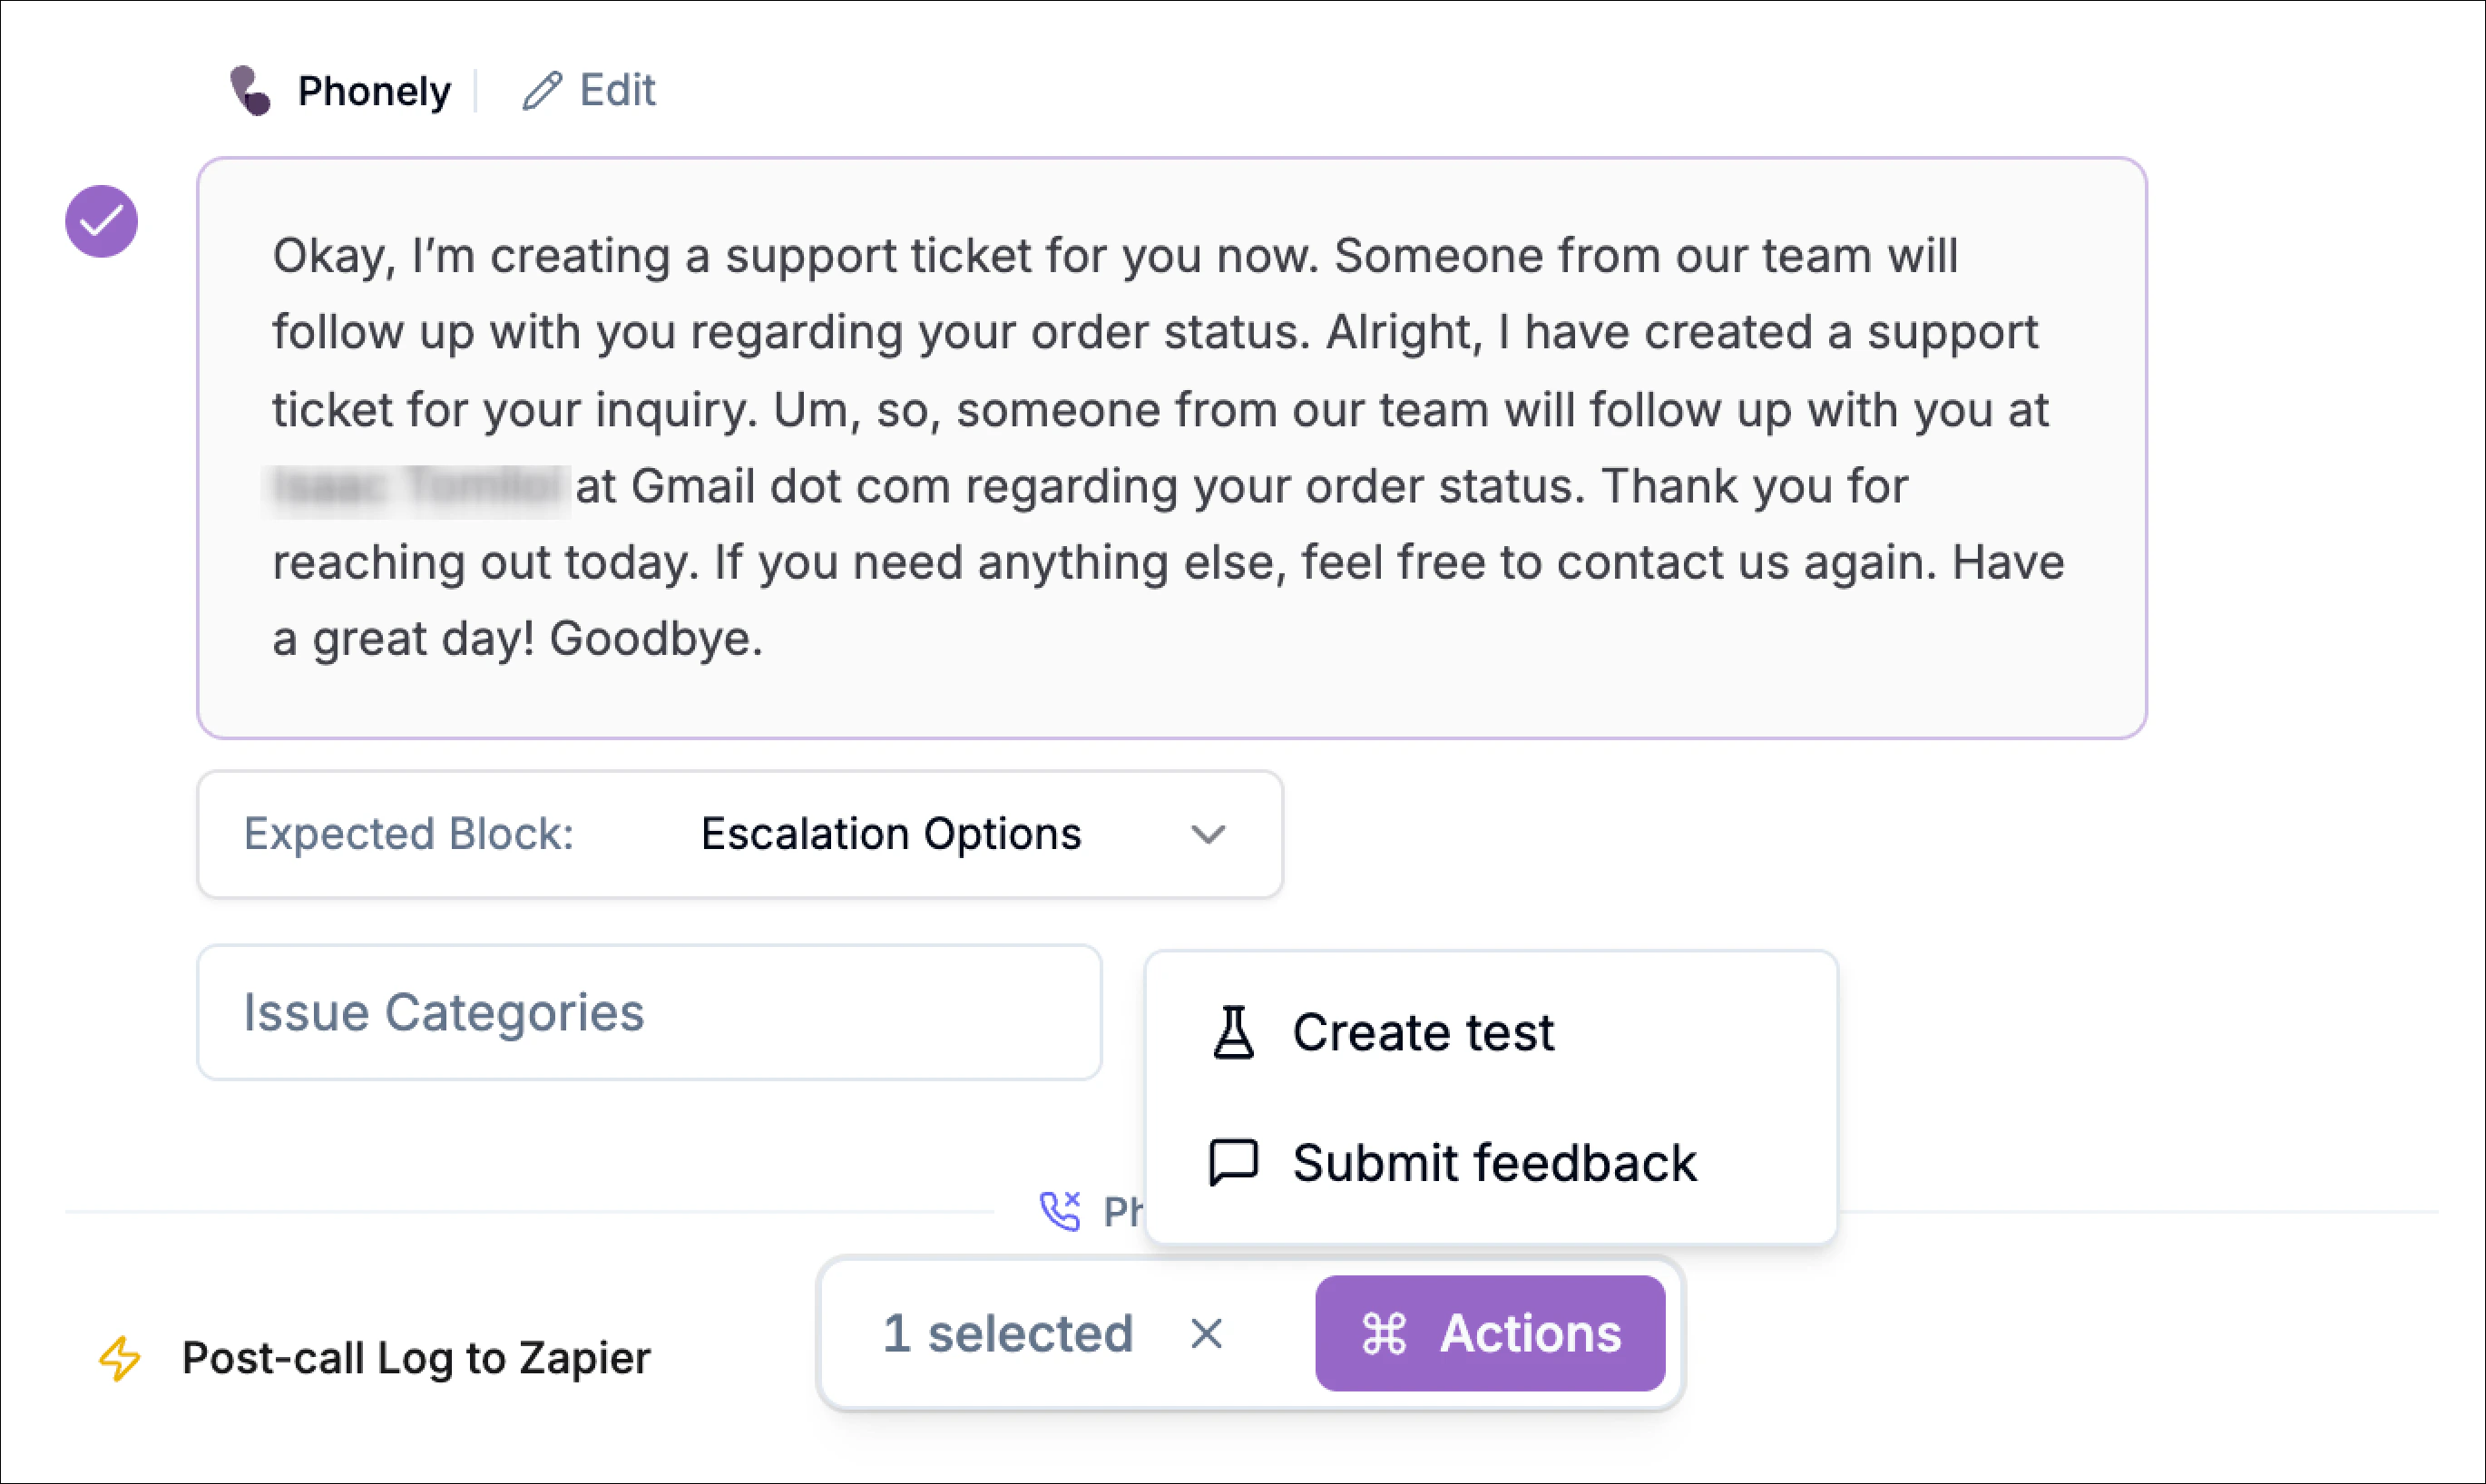
Clicking the feedback button marks the response and enables additional review options. After providing feedback, an **Edit** option appears next to the response.
Click the **Edit** button to open the response editor, where you can modify how the agent should respond in similar situations.
In the editor you can:
* Update the expected response text.
* Specify the expected block that should handle the message (for example, *Main Routing* or another workflow block).
* Assign issue categories to describe the type of problem observed in the response.
Issue categories help identify patterns in responses that may require improvement, such as:
* Statement after question
* Multi-Question turn
* Unnecessary confirmation
* Missing confirmation
* Over-collecting
* Spelled-out numbers
* Overly verbose etc.
When one or more responses are selected, an **Actions** menu becomes available.
From the **Actions** menu you can perform tasks such as:
* **Create test** – generate a test case based on the selected response.
* **Submit feedback** – record feedback for workflow review.
At the bottom of the conversation panel, an **audio player** allows you to listen to the full call recording while reviewing the conversation.
* Play and pause
* Timeline scrubbing
* Playback speed adjustment
* Downloading the call audio
* Providing feedback on the call
## Highlights Tab
The Highlights tab provides a concise, structured overview of the entire call at a glance. It’s designed to help you quickly understand what happened during the conversation, what actions were taken, and how the call concluded, without needing to review the full transcript.
This tab is useful when you want to quickly understand what happened during a call without reviewing the entire transcript.
### Call Summary
At the top of the page, Phonely generates a clear, human-readable summary of the call.
* Describes the caller’s intent (for example, *order status inquiry* or *appointment booking*)
* Explains what the AI attempted and what ultimately happened
* Highlights key outcomes, such as whether a record was found, and action succeeded, or a fallback was triggered
This summary is automatically generated and updated based on the full conversation context.
### Caller Details
The **call details** section shows structured metadata about the call.
These fields include:
Displays the phone number associated with the call.
Indicates why the call ended
Shows the detected topic or intent of the conversation
Displays the final outcome reached during the workflow.
### Actions Timeline
The actions section displays the workflow steps that occurred during the call. Each step represents a workflow block or automation action executed during the interaction.
### Duration Timeline
The duration timeline provides a visual representation of how the call progressed over time. Each colored segment represents a workflow block executed during the call.
Hovering over a segment reveals details such as: block name, duration and number of conversation turns. This view helps identify slow or repetitive patterns within the call.
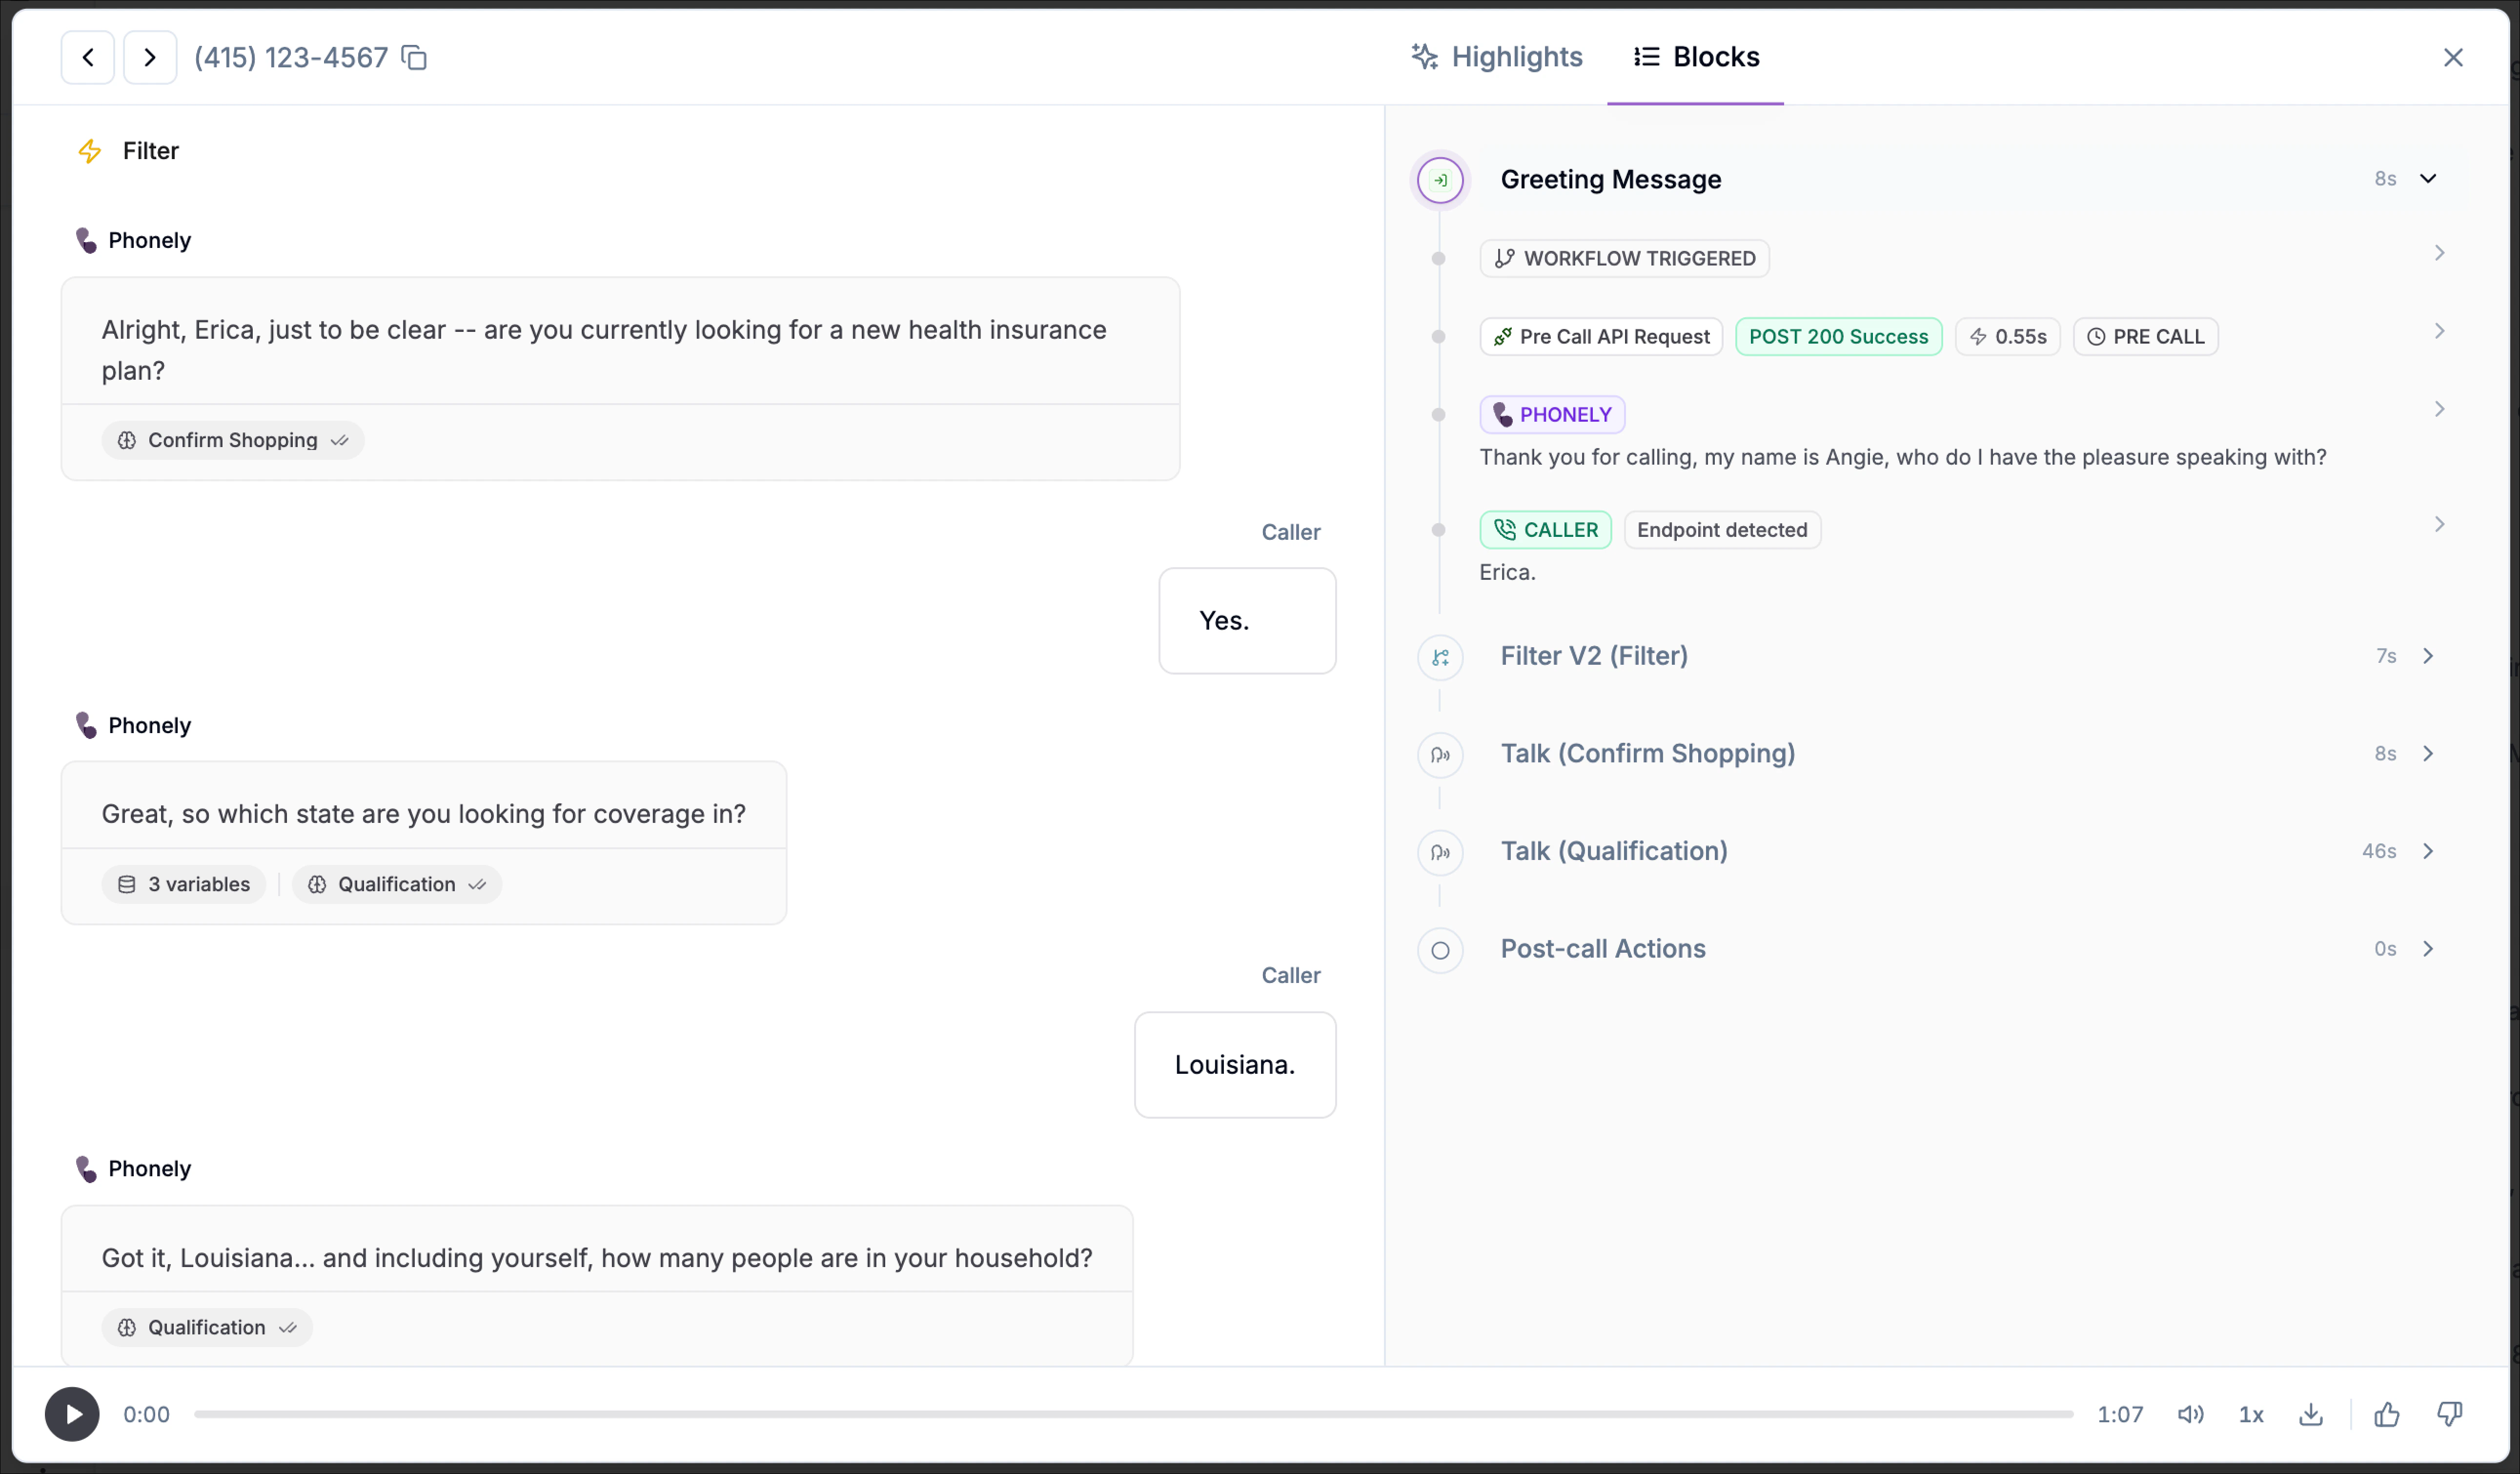
## Blocks Tab
The **Blocks** tab provides a structured, execution-level view of how the call moved through your workflow. It shows every block that ran, when it ran, how long it took, and whether it completed successfully, making it ideal for debugging, auditing, and optimization.
### Block Execution Overview
At the top level, the Blocks tab displays a table with one row per executed block, including:
* **Block Name** – The label of the block as defined in your workflow (for example, *Greeting Message*, *Talk*, *API Request*)
* **Block** – The specific workflow block instance that was executed.
* **Timestamp** – The exact time the block started during the call.
* **Duration** – How long the block ran.
* **Status** – Execution result (for example, *Completed*).
This view gives you a chronological summary of the entire call flow from start to finish.
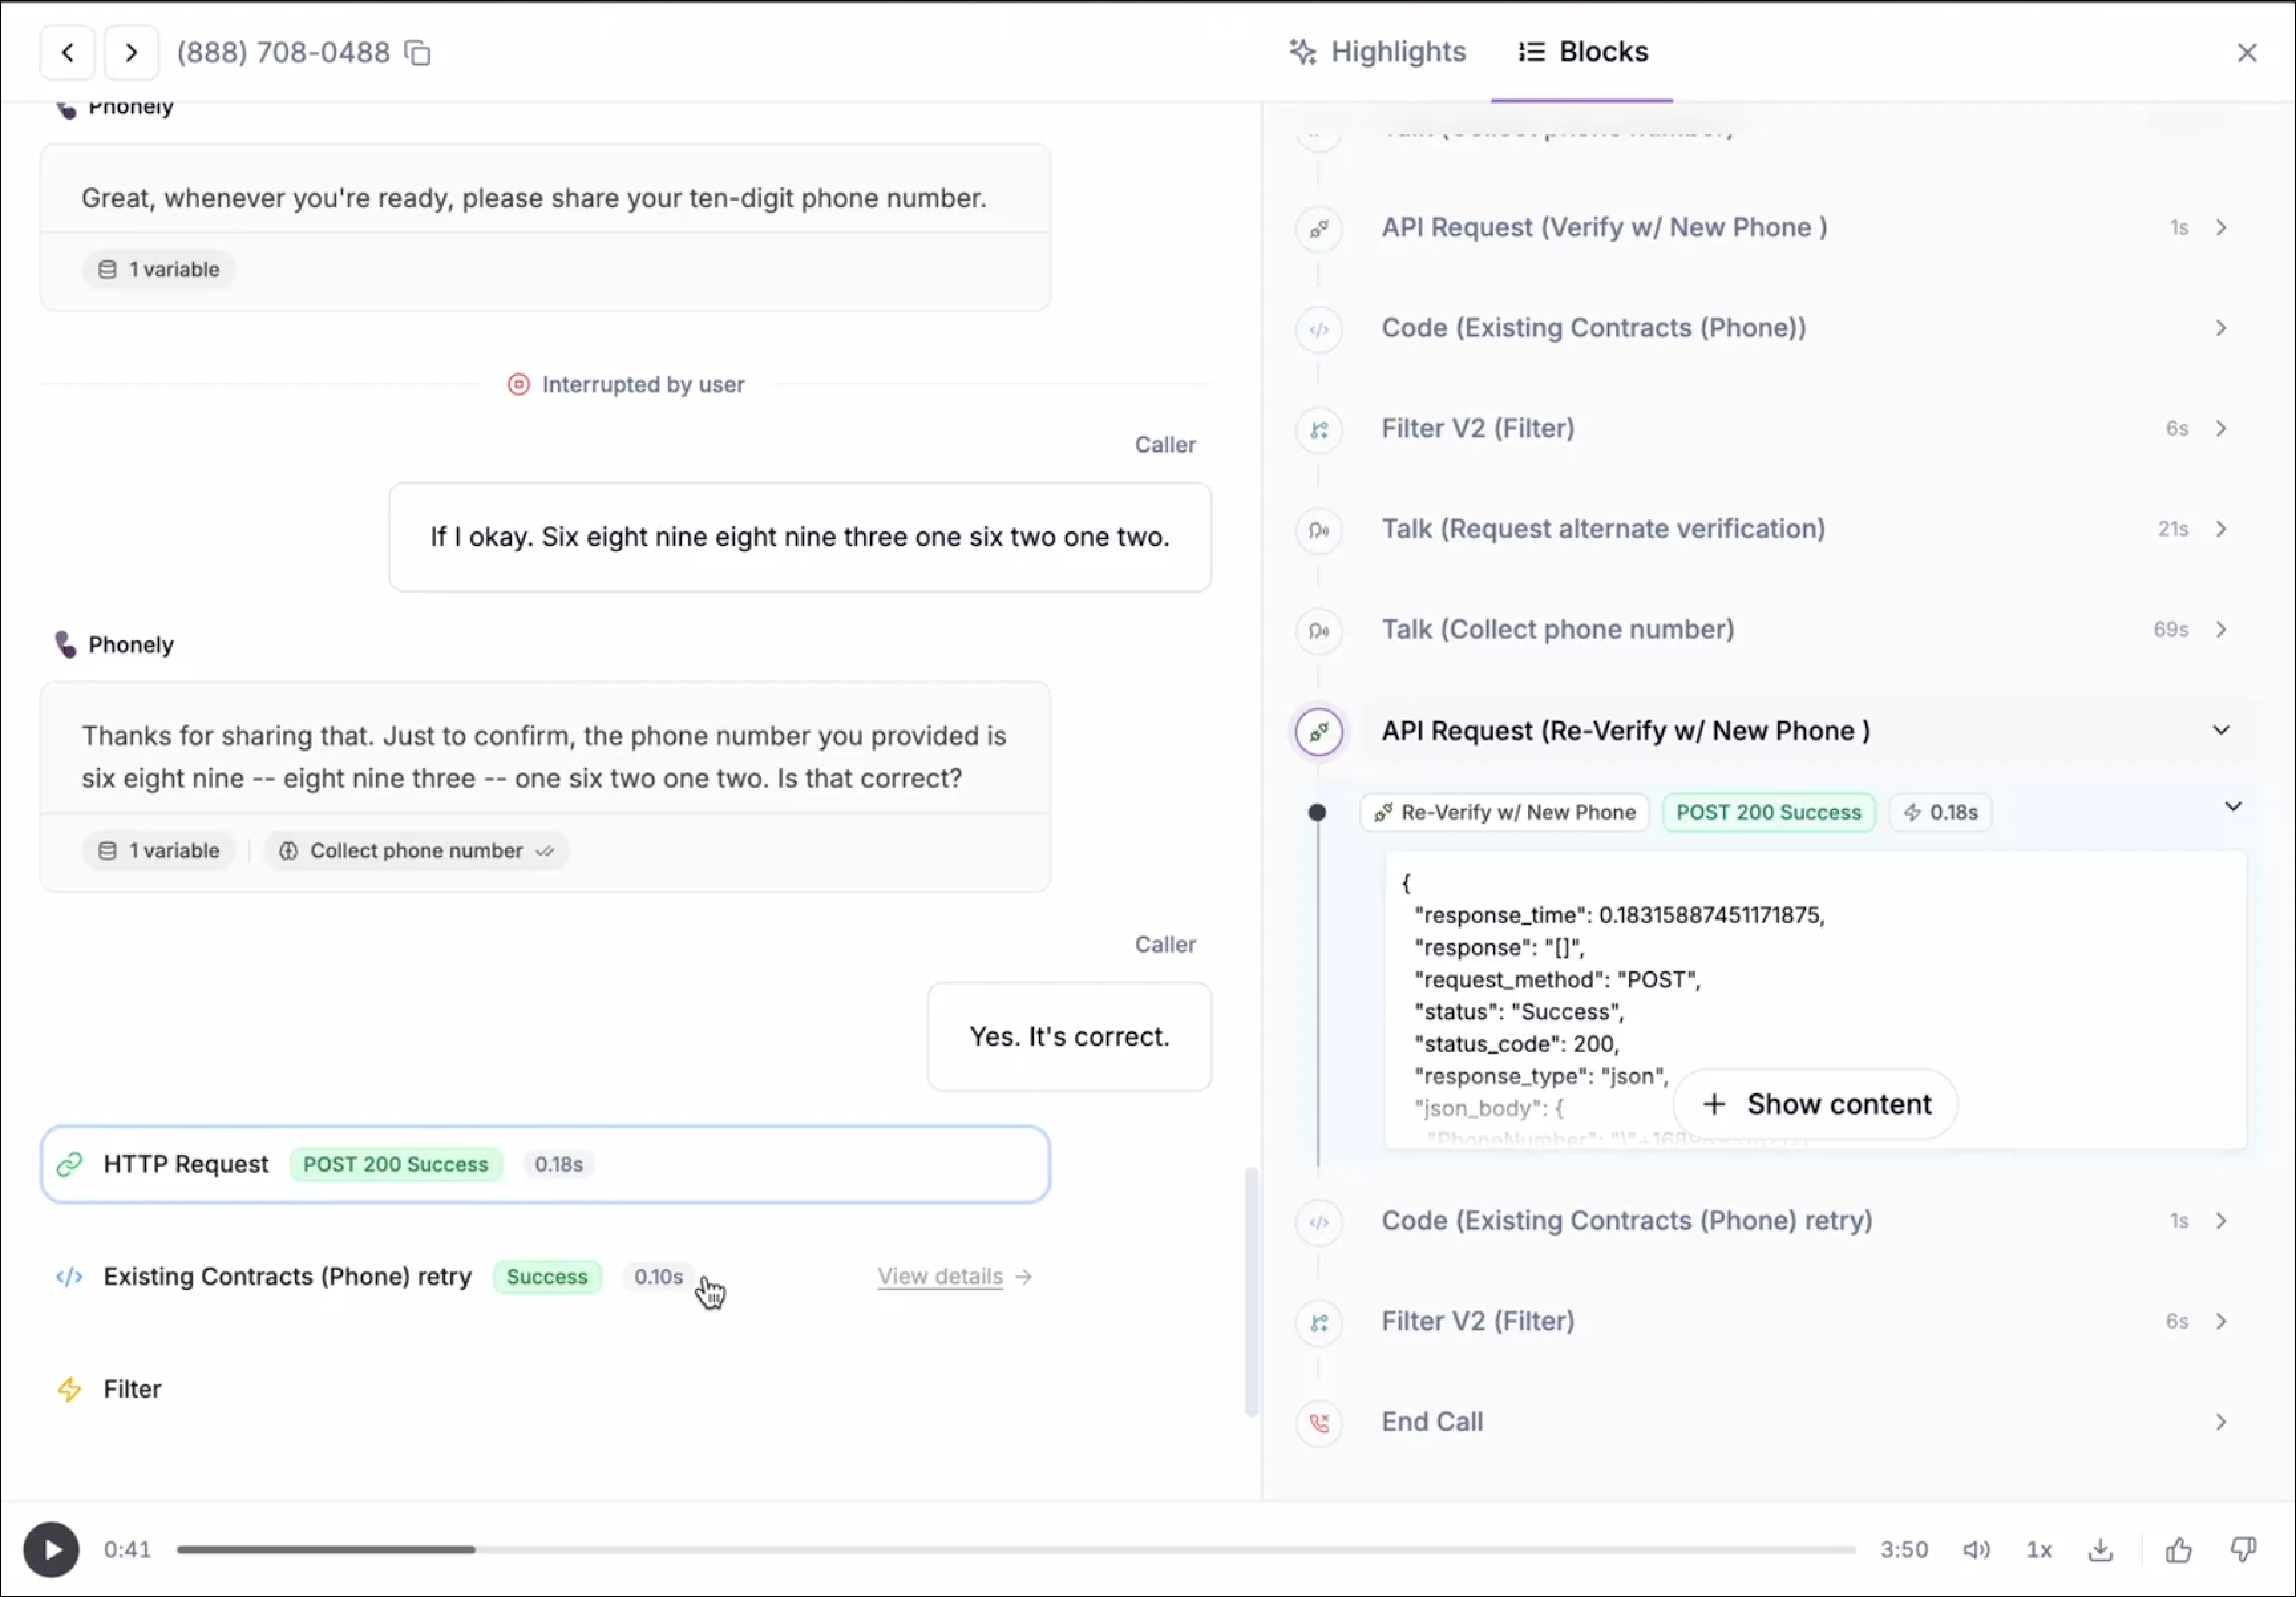
### Expanding a Block for Details
Click the arrow next to any block to expand it and view detailed execution data. Expanded blocks reveal a structured event log showing exactly what happened inside that block.
Each expanded block includes:
* **Timestamp** – When each event occurred.
* **Event Type** – What kind of action took place.
* **Data** – The payload, message, or response associated with the event.
### Event Types You May See
Depending on the block type, expanded views may include:
* **AI Speech** – Messages spoken by the agent.
* **User Input** – Transcribed caller responses.
* **Referenced Knowledge Base** – Knowledge or documents referenced during the block.
* **Block Transition** – Movement between workflow blocks.
* **API / Webhook Requests** – Outbound requests with full request and response details.
* **System Actions** – Internal workflow or execution events.
### API Request Visibility
For API and webhook blocks, the Blocks tab provides full transparency into external calls, including:
* Request URL and method
* Request body
* Response body
* HTTP status code
* Execution time
This makes it easy to verify integrations, troubleshoot failures, and confirm downstream systems received the expected data.
At the bottom of expanded sections, you may see:
* **Total Events** – Number of events recorded for that block.
* **Duration** – Total execution time for the block.
## Exporting Selected Calls and Running Reports
The export and report option allow you to analyze call performance or share data externally. Use export selected calls when you want to download specific calls manually from the list.
1. From the call history table, check the calls you want to include. You can select one or multiple rows.
2. Click **Export Selected Calls**. This action downloads a **CSV file** containing detailed data for only those calls.
 Issue categories help identify patterns in responses that may require improvement, such as:
 ## Key Features
| Feature | Description |
| :------------------------------------- | :------------------------------------------------------------------------------------------------------------------------------------------------------------------------------------------------------------------ |
| **Comprehensive Call Logging** | Every inbound, outbound, and web call is automatically logged with duration, call type, detected topic, outcome, sentiment, and end reason for full visibility into each interaction. |
| **Modernized Call History Experience** | The Call History page has been redesigned for speed and clarity, featuring infinite scroll (no pagination), auto-refresh every 10 seconds, and smoother day-to-day navigation. |
| **Advanced Filtering & Views** | Quickly narrow results using a redesigned filter module with support for date range, duration, call type, outcome, sentiment, status, and end reason, plus dedicated views for in-progress calls and calls on hold. |
| **Read & Unread Call Tracking** | Easily distinguish new calls from reviewed ones with clear read/unread indicators, bulk selection, and “select all” actions for faster triage. |
| **Context at a Glance** | Instantly see sentiment indicators and a short AI-generated recap of why the caller reached out, helping you prioritize which calls to open first. |
| **Playback Controls** | Replay any call, adjust playback speed, or download audio recordings for QA or training. |
| **Powerful Global Search** | Search across call outcomes, transcripts, and phone numbers to quickly locate specific conversations or patterns. |
| **Detailed Call Insights** | Open any call to review summaries, full transcripts, and how the conversation progressed through individual workflow blocks. |
| **Outcome & End Reason Tracking** | Understand exactly how calls ended whether customer-ended, AI-ended, transferred, timed out, or placed on hold. |
| **Call Path Analysis** | Identify which workflows, outcomes, and paths are most common across your calls to guide optimization and flow improvements. |
| **Analyze with AI** | Select any group of calls and use AI to understand what's happening -- why callers are reaching out, where conversations go well, and where they need improvement. |
# Analyze with AI
When you're reviewing calls, you can select any group of conversations and ask AI to help you understand what's going on. Instead of listening to each call one by one, you can get answers about trends, issues, and opportunities across all of them at once.
## Key Features
| Feature | Description |
| :------------------------------------- | :------------------------------------------------------------------------------------------------------------------------------------------------------------------------------------------------------------------ |
| **Comprehensive Call Logging** | Every inbound, outbound, and web call is automatically logged with duration, call type, detected topic, outcome, sentiment, and end reason for full visibility into each interaction. |
| **Modernized Call History Experience** | The Call History page has been redesigned for speed and clarity, featuring infinite scroll (no pagination), auto-refresh every 10 seconds, and smoother day-to-day navigation. |
| **Advanced Filtering & Views** | Quickly narrow results using a redesigned filter module with support for date range, duration, call type, outcome, sentiment, status, and end reason, plus dedicated views for in-progress calls and calls on hold. |
| **Read & Unread Call Tracking** | Easily distinguish new calls from reviewed ones with clear read/unread indicators, bulk selection, and “select all” actions for faster triage. |
| **Context at a Glance** | Instantly see sentiment indicators and a short AI-generated recap of why the caller reached out, helping you prioritize which calls to open first. |
| **Playback Controls** | Replay any call, adjust playback speed, or download audio recordings for QA or training. |
| **Powerful Global Search** | Search across call outcomes, transcripts, and phone numbers to quickly locate specific conversations or patterns. |
| **Detailed Call Insights** | Open any call to review summaries, full transcripts, and how the conversation progressed through individual workflow blocks. |
| **Outcome & End Reason Tracking** | Understand exactly how calls ended whether customer-ended, AI-ended, transferred, timed out, or placed on hold. |
| **Call Path Analysis** | Identify which workflows, outcomes, and paths are most common across your calls to guide optimization and flow improvements. |
| **Analyze with AI** | Select any group of calls and use AI to understand what's happening -- why callers are reaching out, where conversations go well, and where they need improvement. |
# Analyze with AI
When you're reviewing calls, you can select any group of conversations and ask AI to help you understand what's going on. Instead of listening to each call one by one, you can get answers about trends, issues, and opportunities across all of them at once.
 ### How to Use It
1. Open **Call History** from the left navigation.
2. Select one or more calls using the checkboxes.
3. Click **Analyze with AI** in the action bar.
4. Ask a question about the selected calls.
You can click on any call in the conversation to jump directly to its full detail view.
### What You Can Ask
* "Why are callers hanging up during the greeting?"
* "Which of these calls resulted in a booked appointment?"
* "What are the most common questions callers are asking this week?"
* "Are there any calls where the agent gave incorrect information?"
* "How are these calls being handled differently from each other?"
## Filtering & Sorting Calls
To open the filters panel, click the filter icon in the top-right corner of the call history page. The panel slides in, allowing you to refine the call list in real time.
### How to Use It
1. Open **Call History** from the left navigation.
2. Select one or more calls using the checkboxes.
3. Click **Analyze with AI** in the action bar.
4. Ask a question about the selected calls.
You can click on any call in the conversation to jump directly to its full detail view.
### What You Can Ask
* "Why are callers hanging up during the greeting?"
* "Which of these calls resulted in a booked appointment?"
* "What are the most common questions callers are asking this week?"
* "Are there any calls where the agent gave incorrect information?"
* "How are these calls being handled differently from each other?"
## Filtering & Sorting Calls
To open the filters panel, click the filter icon in the top-right corner of the call history page. The panel slides in, allowing you to refine the call list in real time.
 Use the filters panel to narrow your call list and focus on specific scenarios.
### Available Filters
| Filter Category | Options |
| :----------------- | :------------------------------------------------------------------------------------------------------------------------------------------------------------------------ |
| **Date Range** | Today, Yesterday, Last 7 days, Last 14 days, Last 30 days, Last 90 days, Custom range (calendar picker) |
| **Duration** | Presets: \< 1 min, 1–5 min, > 5 min
Use the filters panel to narrow your call list and focus on specific scenarios.
### Available Filters
| Filter Category | Options |
| :----------------- | :------------------------------------------------------------------------------------------------------------------------------------------------------------------------ |
| **Date Range** | Today, Yesterday, Last 7 days, Last 14 days, Last 30 days, Last 90 days, Custom range (calendar picker) |
| **Duration** | Presets: \< 1 min, 1–5 min, > 5 min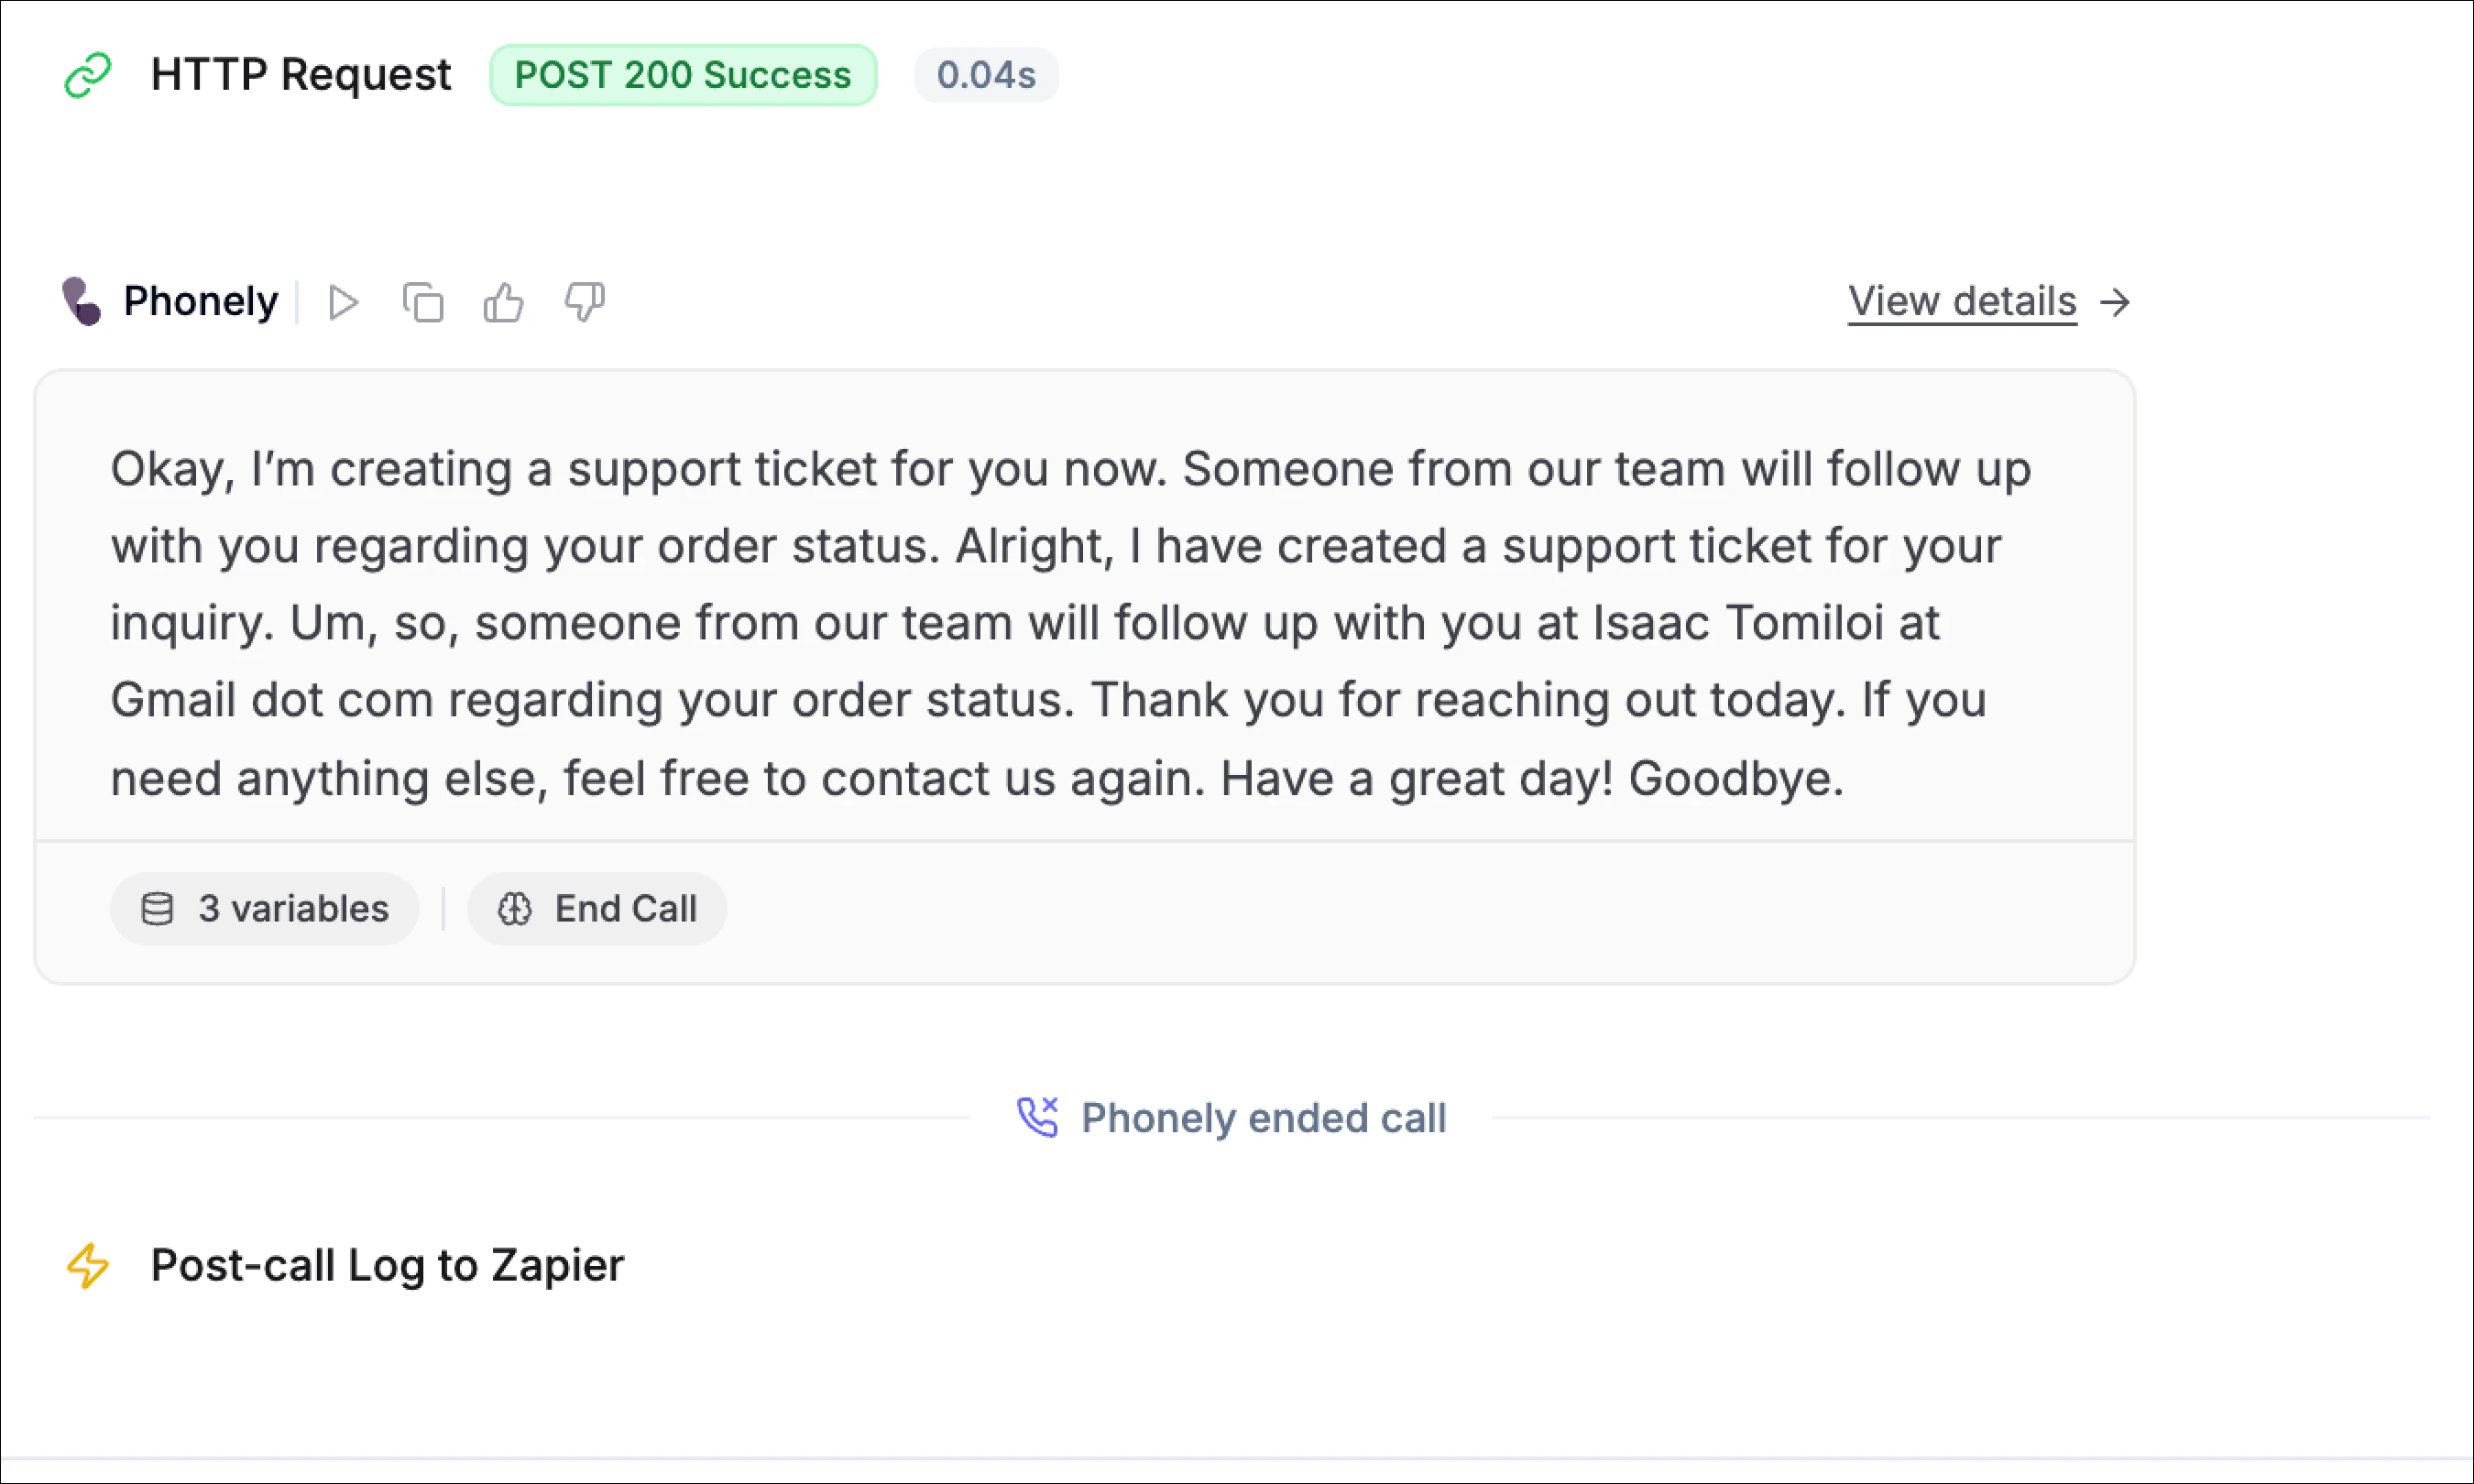
 ### Call Summary
At the top of the page, Phonely generates a clear, human-readable summary of the call.
* Describes the caller’s intent (for example, *order status inquiry* or *appointment booking*)
* Explains what the AI attempted and what ultimately happened
* Highlights key outcomes, such as whether a record was found, and action succeeded, or a fallback was triggered
This summary is automatically generated and updated based on the full conversation context.
### Caller Details
The **call details** section shows structured metadata about the call.
These fields include:
### Call Summary
At the top of the page, Phonely generates a clear, human-readable summary of the call.
* Describes the caller’s intent (for example, *order status inquiry* or *appointment booking*)
* Explains what the AI attempted and what ultimately happened
* Highlights key outcomes, such as whether a record was found, and action succeeded, or a fallback was triggered
This summary is automatically generated and updated based on the full conversation context.
### Caller Details
The **call details** section shows structured metadata about the call.
These fields include:
 ### Block Execution Overview
At the top level, the Blocks tab displays a table with one row per executed block, including:
* **Block Name** – The label of the block as defined in your workflow (for example, *Greeting Message*, *Talk*, *API Request*)
* **Block** – The specific workflow block instance that was executed.
* **Timestamp** – The exact time the block started during the call.
* **Duration** – How long the block ran.
* **Status** – Execution result (for example, *Completed*).
This view gives you a chronological summary of the entire call flow from start to finish.
### Expanding a Block for Details
Click the arrow next to any block to expand it and view detailed execution data. Expanded blocks reveal a structured event log showing exactly what happened inside that block.
Each expanded block includes:
* **Timestamp** – When each event occurred.
* **Event Type** – What kind of action took place.
* **Data** – The payload, message, or response associated with the event.
### Event Types You May See
Depending on the block type, expanded views may include:
* **AI Speech** – Messages spoken by the agent.
* **User Input** – Transcribed caller responses.
* **Referenced Knowledge Base** – Knowledge or documents referenced during the block.
* **Block Transition** – Movement between workflow blocks.
* **API / Webhook Requests** – Outbound requests with full request and response details.
* **System Actions** – Internal workflow or execution events.
### API Request Visibility
For API and webhook blocks, the Blocks tab provides full transparency into external calls, including:
* Request URL and method
* Request body
* Response body
* HTTP status code
* Execution time
### Block Execution Overview
At the top level, the Blocks tab displays a table with one row per executed block, including:
* **Block Name** – The label of the block as defined in your workflow (for example, *Greeting Message*, *Talk*, *API Request*)
* **Block** – The specific workflow block instance that was executed.
* **Timestamp** – The exact time the block started during the call.
* **Duration** – How long the block ran.
* **Status** – Execution result (for example, *Completed*).
This view gives you a chronological summary of the entire call flow from start to finish.
### Expanding a Block for Details
Click the arrow next to any block to expand it and view detailed execution data. Expanded blocks reveal a structured event log showing exactly what happened inside that block.
Each expanded block includes:
* **Timestamp** – When each event occurred.
* **Event Type** – What kind of action took place.
* **Data** – The payload, message, or response associated with the event.
### Event Types You May See
Depending on the block type, expanded views may include:
* **AI Speech** – Messages spoken by the agent.
* **User Input** – Transcribed caller responses.
* **Referenced Knowledge Base** – Knowledge or documents referenced during the block.
* **Block Transition** – Movement between workflow blocks.
* **API / Webhook Requests** – Outbound requests with full request and response details.
* **System Actions** – Internal workflow or execution events.
### API Request Visibility
For API and webhook blocks, the Blocks tab provides full transparency into external calls, including:
* Request URL and method
* Request body
* Response body
* HTTP status code
* Execution time
 This makes it easy to verify integrations, troubleshoot failures, and confirm downstream systems received the expected data.
At the bottom of expanded sections, you may see:
* **Total Events** – Number of events recorded for that block.
* **Duration** – Total execution time for the block.
## Exporting Selected Calls and Running Reports
The export and report option allow you to analyze call performance or share data externally. Use export selected calls when you want to download specific calls manually from the list.
1. From the call history table, check the calls you want to include. You can select one or multiple rows.
2. Click **Export Selected Calls**. This action downloads a **CSV file** containing detailed data for only those calls.
This makes it easy to verify integrations, troubleshoot failures, and confirm downstream systems received the expected data.
At the bottom of expanded sections, you may see:
* **Total Events** – Number of events recorded for that block.
* **Duration** – Total execution time for the block.
## Exporting Selected Calls and Running Reports
The export and report option allow you to analyze call performance or share data externally. Use export selected calls when you want to download specific calls manually from the list.
1. From the call history table, check the calls you want to include. You can select one or multiple rows.
2. Click **Export Selected Calls**. This action downloads a **CSV file** containing detailed data for only those calls.
